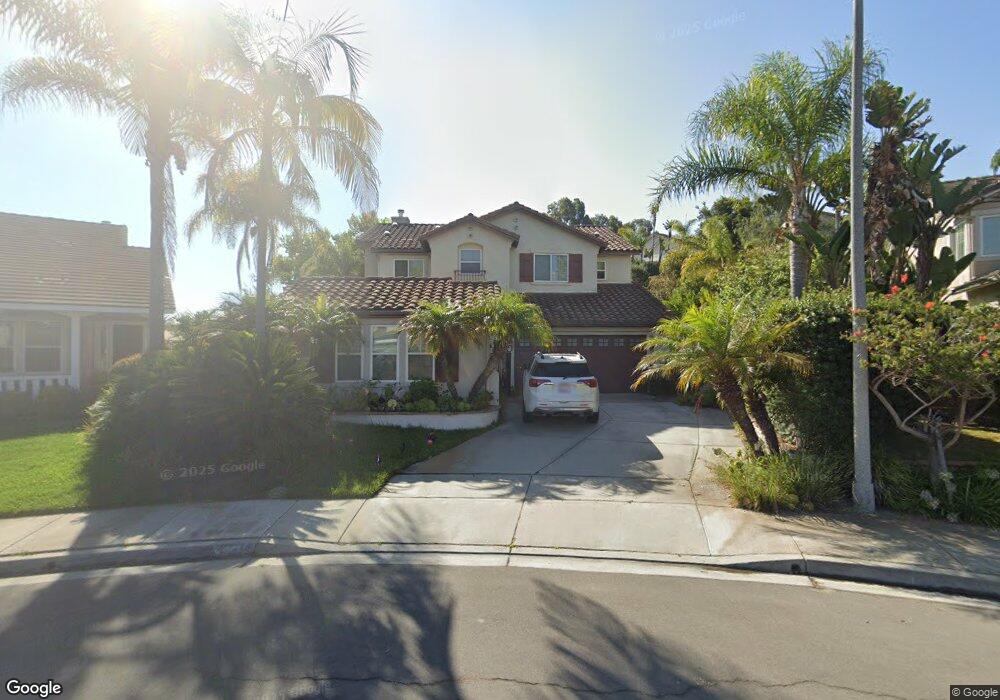
2371 Merwin Dr Carlsbad, CA 92008
Kelly Ranch NeighborhoodEstimated Value: $1,837,000 - $2,122,000
5
Beds
3
Baths
2,810
Sq Ft
$686/Sq Ft
Est. Value
About This Home
This home is located at 2371 Merwin Dr, Carlsbad, CA 92008 and is currently estimated at $1,928,858, approximately $686 per square foot. 2371 Merwin Dr is a home located in San Diego County with nearby schools including Kelly Elementary School, Sage Creek High, and Carlsbad High School.
Ownership History
Date
Name
Owned For
Owner Type
Purchase Details
Closed on
Nov 23, 2015
Sold by
Bilar John F and Bilar Sasha S
Bought by
Bilar Trust and Bilar Sasha S
Current Estimated Value
Purchase Details
Closed on
Dec 17, 2001
Sold by
Bilar John F
Bought by
Bilar John F and Bilar Sasha S
Home Financials for this Owner
Home Financials are based on the most recent Mortgage that was taken out on this home.
Original Mortgage
$345,000
Outstanding Balance
$127,796
Interest Rate
5.87%
Estimated Equity
$1,801,062
Purchase Details
Closed on
Jul 20, 2000
Sold by
Shea Homes Ltd Partnership
Bought by
Bilar John F and Bilar Sasha S
Home Financials for this Owner
Home Financials are based on the most recent Mortgage that was taken out on this home.
Original Mortgage
$343,250
Interest Rate
8%
Create a Home Valuation Report for This Property
The Home Valuation Report is an in-depth analysis detailing your home's value as well as a comparison with similar homes in the area
Home Values in the Area
Average Home Value in this Area
Purchase History
| Date | Buyer | Sale Price | Title Company |
|---|---|---|---|
| Bilar Trust | -- | None Available | |
| Bilar John F | -- | Gateway Title Company | |
| Bilar John F | -- | Gateway Title Company | |
| Bilar John F | $429,500 | First American Title |
Source: Public Records
Mortgage History
| Date | Status | Borrower | Loan Amount |
|---|---|---|---|
| Open | Bilar John F | $345,000 | |
| Closed | Bilar John F | $343,250 |
Source: Public Records
Tax History
| Year | Tax Paid | Tax Assessment Tax Assessment Total Assessment is a certain percentage of the fair market value that is determined by local assessors to be the total taxable value of land and additions on the property. | Land | Improvement |
|---|---|---|---|---|
| 2025 | $7,966 | $690,191 | $188,344 | $501,847 |
| 2024 | $7,966 | $676,658 | $184,651 | $492,007 |
| 2023 | $7,928 | $663,391 | $181,031 | $482,360 |
| 2022 | $7,817 | $650,384 | $177,482 | $472,902 |
| 2021 | $7,763 | $637,632 | $174,002 | $463,630 |
| 2020 | $7,715 | $631,095 | $172,218 | $458,877 |
| 2019 | $7,589 | $618,722 | $168,842 | $449,880 |
| 2018 | $7,300 | $606,591 | $165,532 | $441,059 |
| 2017 | $7,191 | $594,698 | $162,287 | $432,411 |
| 2016 | $6,932 | $583,038 | $159,105 | $423,933 |
| 2015 | $6,907 | $574,282 | $156,716 | $417,566 |
| 2014 | $6,803 | $563,034 | $153,647 | $409,387 |
Source: Public Records
Map
Nearby Homes
- 5077 Ashberry Rd
- 5128 Don Mata Dr
- 3445 Don Ortega Dr
- 5115 Don Miguel Dr Unit 165
- 3438 Don Ortega Dr
- 3430 Don Cota Dr Unit 233
- 3466 Don Lorenzo Dr Unit 324
- 5114 Don Miguel Dr Unit 152
- 3462 Don Ortega Dr
- 5406 Don Luis Dr Unit 495
- 5140 Don Rodolfo Dr Unit 178
- 5459 Don Felipe Dr Unit 485
- 5229 Don Valdez Dr
- 5307 Don Ricardo Dr Unit 68
- 3446 Don Cota Dr Unit 235
- 3438 Don Alberto Dr Unit 434
- 2336 Summerwind Place
- 4967 Cindy Ave
- 5146 Delaney Ct
- 3505 N Fork Ave
- 2367 Merwin Dr
- 2375 Merwin Dr
- 2352 Jeffers Place
- 2363 Merwin Dr
- 2353 Jeffers Place
- 2379 Merwin Dr
- 2348 Jeffers Place
- 2359 Merwin Dr
- 2383 Merwin Dr
- 2349 Jeffers Place
- 2372 Merwin Dr
- 2355 Merwin Dr
- 2344 Jeffers Place
- 2387 Merwin Dr
- 2376 Merwin Dr
- 2345 Jeffers Place
- 2351 Merwin Dr
- 2368 Merwin Dr
- 2380 Merwin Dr
- 2391 Merwin Dr
Your Personal Tour Guide
Ask me questions while you tour the home.