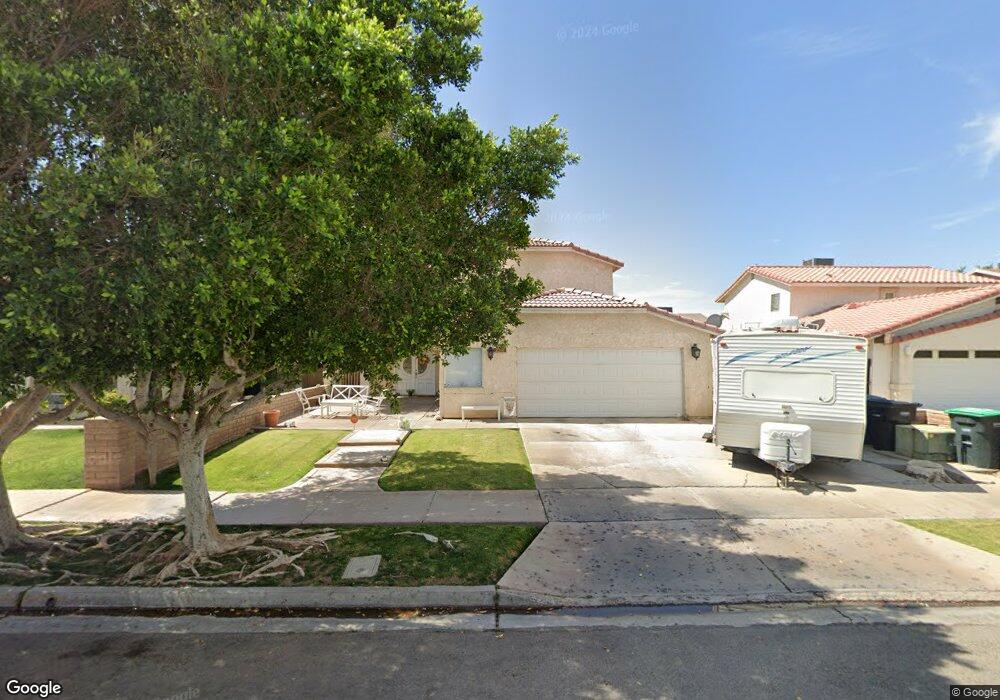
2371 W Elm Ave El Centro, CA 92243
Estimated Value: $405,000 - $442,000
4
Beds
3
Baths
1,765
Sq Ft
$243/Sq Ft
Est. Value
About This Home
This home is located at 2371 W Elm Ave, El Centro, CA 92243 and is currently estimated at $428,463, approximately $242 per square foot. 2371 W Elm Ave is a home located in Imperial County with nearby schools including Sunflower Elementary School, Wilson Jr. High, and Southwest High School.
Ownership History
Date
Name
Owned For
Owner Type
Purchase Details
Closed on
Jan 21, 2022
Sold by
Raymond Alvarez
Bought by
Valadez Martha
Current Estimated Value
Home Financials for this Owner
Home Financials are based on the most recent Mortgage that was taken out on this home.
Original Mortgage
$176,434
Interest Rate
3.45%
Mortgage Type
FHA
Purchase Details
Closed on
Apr 30, 2015
Sold by
Alvarez Raymond and Alvarez Leslie Cachero
Bought by
Alvarez Raymond
Home Financials for this Owner
Home Financials are based on the most recent Mortgage that was taken out on this home.
Original Mortgage
$230,118
Interest Rate
3.67%
Mortgage Type
New Conventional
Purchase Details
Closed on
Aug 21, 2002
Sold by
Picazo Joe and Picazo Carmen
Bought by
Alvarez Raymond
Home Financials for this Owner
Home Financials are based on the most recent Mortgage that was taken out on this home.
Original Mortgage
$167,280
Interest Rate
6.22%
Mortgage Type
VA
Create a Home Valuation Report for This Property
The Home Valuation Report is an in-depth analysis detailing your home's value as well as a comparison with similar homes in the area
Purchase History
We collect this data history from publicly available records. To have your information removed, we recommend requesting removal directly through your county’s website.
| Date | Buyer | Sale Price | Title Company |
|---|---|---|---|
| Valadez Martha | $180,000 | Stewart Title | |
| Alvarez Raymond | -- | Fidelity National Title Co | |
| Alvarez Raymond | $164,000 | Chicago Title Co |
Source: Public Records
Mortgage History
We collect this data history from publicly available records. To have your information removed, we recommend requesting removal directly through your county’s website.
| Date | Status | Borrower | Loan Amount |
|---|---|---|---|
| Closed | Valadez Martha | $176,434 | |
| Previous Owner | Alvarez Raymond | $230,118 | |
| Previous Owner | Alvarez Raymond | $167,280 |
Source: Public Records
Tax History
| Year | Tax Paid | Tax Assessment Tax Assessment Total Assessment is a certain percentage of the fair market value that is determined by local assessors to be the total taxable value of land and additions on the property. | Land | Improvement |
|---|---|---|---|---|
| 2025 | $3,695 | $334,280 | $53,060 | $281,220 |
| 2023 | $3,695 | $321,300 | $51,000 | $270,300 |
| 2022 | $2,513 | $223,815 | $40,936 | $182,879 |
| 2021 | $2,449 | $219,428 | $40,134 | $179,294 |
| 2020 | $2,496 | $217,179 | $39,723 | $177,456 |
| 2019 | $2,420 | $212,922 | $38,945 | $173,977 |
| 2018 | $2,407 | $208,748 | $38,182 | $170,566 |
| 2017 | $2,382 | $204,656 | $37,434 | $167,222 |
| 2016 | $2,334 | $200,644 | $36,700 | $163,944 |
| 2015 | $2,299 | $197,631 | $36,149 | $161,482 |
| 2014 | $1,632 | $140,000 | $35,000 | $105,000 |
Source: Public Records
Map
Nearby Homes
- 2471 W Elm Ave
- 2414 Lenrey Ave
- 2429 Sandalwood Dr
- 2624 Heil Cir
- 2110 Sandalwood Dr
- 2240 Desert Gardens Dr
- 931 Kay Davis Ct
- 1638 S 23rd St
- 1732 W Brighton Ave Unit D
- 1732 S 23rd St
- 1728 W Brighton Ave Unit C
- 1716 W Brighton Ave Unit A
- 1720 W Brighton Ave Unit D
- 2819 Sandalwood Ct
- 103 S Sunset Dr
- 628 W Main Rd
- 1851 W Barbara Worth Dr
- 250 S Santa Rosa Ave
- 1524 W Holt Ave
- 1101 Cottonwood Dr
- 2370 W Hamilton Ave
- 2360 W Hamilton Ave
- 2380 W Hamilton Ave
- 2350 W Hamilton Ave
- 2390 W Hamilton Ave
- 2361 W Elm Ave
- 2381 W Elm Ave
- 2351 W Elm Ave
- 2391 W Elm Ave
- 2330 W Hamilton Ave
- 2410 W Hamilton Ave
- 2371 W Hamilton Ave
- 2361 W Hamilton Ave
- 2381 W Hamilton Ave
- 2331 W Elm Ave
- 2411 W Elm Ave
- 2351 W Hamilton Ave
- 2391 W Hamilton Ave
- 2320 W Hamilton Ave
- 2420 W Hamilton Ave
Your Personal Tour Guide
Ask me questions while you tour the home.