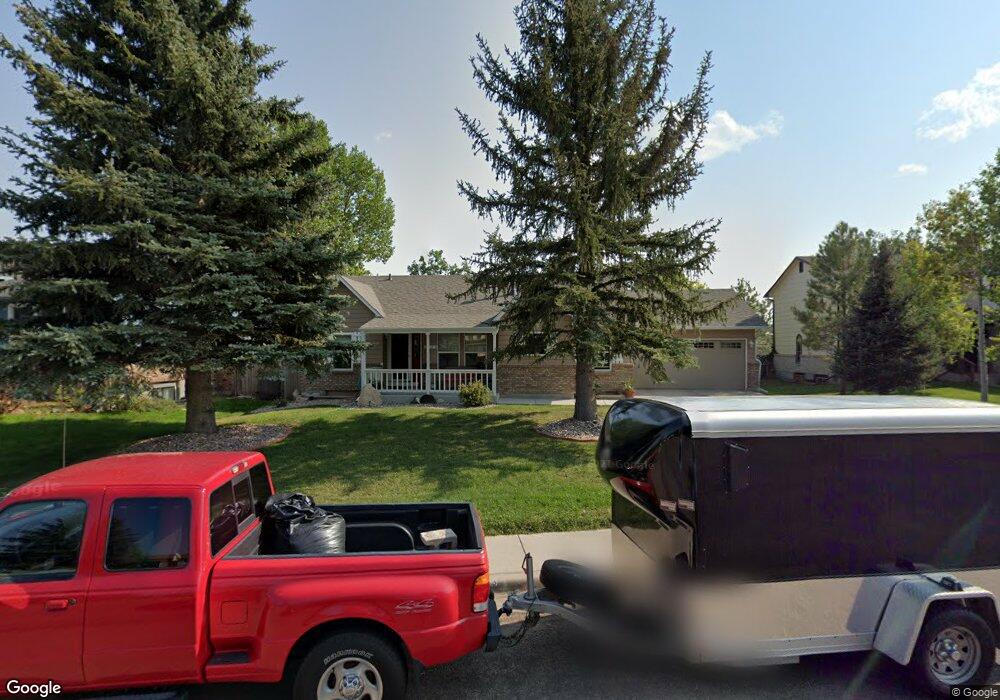
2373 Plain View Rd Cheyenne, WY 82009
Estimated Value: $432,000 - $495,000
Studio
--
Bath
1,390
Sq Ft
$325/Sq Ft
Est. Value
About This Home
This home is located at 2373 Plain View Rd, Cheyenne, WY 82009 and is currently estimated at $452,092, approximately $325 per square foot. 2373 Plain View Rd is a home located in Laramie County with nearby schools including Anderson Elementary School, Carey Junior High School, and East High School.
Ownership History
Date
Name
Owned For
Owner Type
Purchase Details
Closed on
Dec 17, 2014
Sold by
Dahill James M and Dahill Kathe A
Bought by
Dahill James Murray and Dahill Kathe Annice
Current Estimated Value
Home Financials for this Owner
Home Financials are based on the most recent Mortgage that was taken out on this home.
Original Mortgage
$15,000
Interest Rate
4.04%
Mortgage Type
Future Advance Clause Open End Mortgage
Purchase Details
Closed on
Sep 26, 2012
Sold by
Dahill James M and Dahill Kathe A
Bought by
Dahill James Murray and Dahill Kathe Annice
Home Financials for this Owner
Home Financials are based on the most recent Mortgage that was taken out on this home.
Original Mortgage
$103,773
Interest Rate
3.7%
Mortgage Type
Purchase Money Mortgage
Create a Home Valuation Report for This Property
The Home Valuation Report is an in-depth analysis detailing your home's value as well as a comparison with similar homes in the area
Purchase History
We collect this data history from publicly available records. To have your information removed, we recommend requesting removal directly through your county’s website.
| Date | Buyer | Sale Price | Title Company |
|---|---|---|---|
| Dahill James Murray | -- | None Available | |
| Dahill James M | -- | None Available | |
| Dahill James Murray | -- | None Available | |
| Dahill James M | -- | None Available |
Source: Public Records
Mortgage History
We collect this data history from publicly available records. To have your information removed, we recommend requesting removal directly through your county’s website.
| Date | Status | Borrower | Loan Amount |
|---|---|---|---|
| Closed | Dahill James M | $15,000 | |
| Closed | Dahill James M | $103,773 |
Source: Public Records
Tax History
| Year | Tax Paid | Tax Assessment Tax Assessment Total Assessment is a certain percentage of the fair market value that is determined by local assessors to be the total taxable value of land and additions on the property. | Land | Improvement |
|---|---|---|---|---|
| 2025 | $2,610 | $27,915 | $4,536 | $23,379 |
| 2024 | $2,610 | $36,918 | $6,048 | $30,870 |
| 2023 | $2,589 | $36,610 | $6,048 | $30,562 |
| 2022 | $2,380 | $32,975 | $6,048 | $26,927 |
| 2021 | $2,015 | $27,859 | $6,048 | $21,811 |
| 2020 | $1,952 | $27,052 | $6,048 | $21,004 |
| 2019 | $1,807 | $25,024 | $6,048 | $18,976 |
| 2018 | $1,693 | $23,666 | $5,572 | $18,094 |
| 2017 | $1,674 | $23,199 | $5,572 | $17,627 |
| 2016 | $1,605 | $22,227 | $5,381 | $16,846 |
| 2015 | $1,632 | $22,594 | $5,381 | $17,213 |
| 2014 | $1,590 | $21,871 | $5,248 | $16,623 |
Source: Public Records
Map
Nearby Homes
- 5230 Timberline Rd
- 2218 Apache St
- 2524 Plain View Rd
- 2508 Windmill Rd
- 5210 Windmill Rd
- 5020 Mountain Rd
- 5060 Timberline Rd
- 5808 Crestridge Dr
- 2617 Sagebrush Ave
- 5005 Windmill Rd
- 2117 Briarwood Ln
- 5736 Blue Bluff
- 4932 Grandview Ave
- 5036 Greybull Ave
- 4700 King Arthur Way
- 4728 Linden Way
- 4729 Linden Way
- 3115 Bluff Place
- 4703 Linden Way
- 3158 Bluff Place
- 2365 Plain View Rd
- 2381 Plain View Rd
- 2372 Pattison Ave
- 2357 Plain View Rd
- 2389 Plain View Rd
- 2364 Pattison Ave
- 2380 Pattison Ave
- 2356 Pattison Ave
- 5400 Mountain Rd
- 2364 Plain View Rd
- 2349 Plain View Rd
- 2372 Plain View Rd
- 2356 Plain View Rd
- 2380 Plain View Rd
- 2348 Pattison Ave
- 2348 Plain View Rd
- 2341 Plain View Rd
- 2388 Plain View Rd
- 2373 Pattison Ave
- 2365 Pattison Ave
Your Personal Tour Guide
Ask me questions while you tour the home.