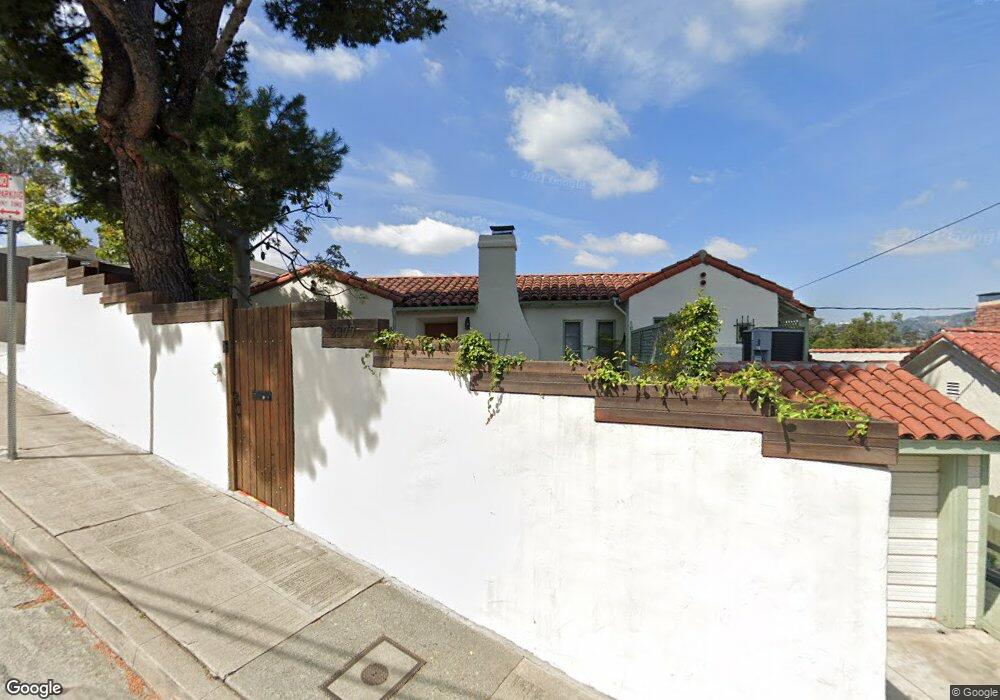
2377 Teviot St Los Angeles, CA 90039
Estimated Value: $1,625,000 - $2,192,000
2
Beds
1
Bath
1,203
Sq Ft
$1,658/Sq Ft
Est. Value
About This Home
This home is located at 2377 Teviot St, Los Angeles, CA 90039 and is currently estimated at $1,994,772, approximately $1,658 per square foot. 2377 Teviot St is a home located in Los Angeles County with nearby schools including Clifford Street Elementary School, Allesandro Elementary, and Irving STEAM Magnet School.
Ownership History
Date
Name
Owned For
Owner Type
Purchase Details
Closed on
May 22, 2015
Sold by
Cooper Joshua R
Bought by
Hronopoulos Nicholas and Virdone Lauren
Current Estimated Value
Home Financials for this Owner
Home Financials are based on the most recent Mortgage that was taken out on this home.
Original Mortgage
$1,060,800
Outstanding Balance
$821,039
Interest Rate
3.81%
Mortgage Type
New Conventional
Estimated Equity
$1,173,733
Purchase Details
Closed on
Jul 19, 2012
Sold by
Cooper Joshua R
Bought by
Cooper Joshua R and Novak Ashley E
Home Financials for this Owner
Home Financials are based on the most recent Mortgage that was taken out on this home.
Original Mortgage
$328,000
Interest Rate
3.65%
Mortgage Type
New Conventional
Purchase Details
Closed on
Feb 5, 2002
Sold by
Douglas Frank J
Bought by
Cooper Joshua R
Home Financials for this Owner
Home Financials are based on the most recent Mortgage that was taken out on this home.
Original Mortgage
$400,000
Interest Rate
5.87%
Purchase Details
Closed on
Sep 6, 2001
Sold by
Krohn Douglas H
Bought by
Douglas Frank J
Create a Home Valuation Report for This Property
The Home Valuation Report is an in-depth analysis detailing your home's value as well as a comparison with similar homes in the area
Home Values in the Area
Average Home Value in this Area
Purchase History
| Date | Buyer | Sale Price | Title Company |
|---|---|---|---|
| Hronopoulos Nicholas | $1,326,000 | Lawyers Title | |
| Cooper Joshua R | -- | Lawyers Title | |
| Cooper Joshua R | $696,000 | Commonwealth Land Title Co | |
| Douglas Frank J | $440,000 | Equity Title Company |
Source: Public Records
Mortgage History
| Date | Status | Borrower | Loan Amount |
|---|---|---|---|
| Open | Hronopoulos Nicholas | $1,060,800 | |
| Previous Owner | Cooper Joshua R | $328,000 | |
| Previous Owner | Cooper Joshua R | $400,000 | |
| Closed | Douglas Frank J | $0 |
Source: Public Records
Tax History Compared to Growth
Tax History
| Year | Tax Paid | Tax Assessment Tax Assessment Total Assessment is a certain percentage of the fair market value that is determined by local assessors to be the total taxable value of land and additions on the property. | Land | Improvement |
|---|---|---|---|---|
| 2025 | $18,869 | $1,593,644 | $1,201,846 | $391,798 |
| 2024 | $18,869 | $1,562,397 | $1,178,281 | $384,116 |
| 2023 | $18,497 | $1,531,763 | $1,155,178 | $376,585 |
| 2022 | $17,625 | $1,501,729 | $1,132,528 | $369,201 |
| 2021 | $17,415 | $1,472,284 | $1,110,322 | $361,962 |
| 2019 | $16,886 | $1,428,618 | $1,077,391 | $351,227 |
| 2018 | $16,825 | $1,400,607 | $1,056,266 | $344,341 |
| 2016 | $16,096 | $1,346,221 | $1,015,250 | $330,971 |
| 2015 | $10,249 | $855,511 | $491,674 | $363,837 |
| 2014 | $10,282 | $838,753 | $482,043 | $356,710 |
Source: Public Records
Map
Nearby Homes
- 2416 Teviot St
- 2336 Hidalgo Ave
- 2303 Hidalgo Ave
- 2389 Silver Lake Blvd
- 2377 Silver Ridge Ave
- 2457 Hidalgo Ave
- 2406 Silver Ridge Ave
- 2321 Lake View Ave
- 2222 Bancroft Ave
- 2319 W Loma Vista Place
- 2230 Glendale Blvd
- 2286 Silver Ridge Ave
- 2315 Loma Vista Place
- 0 Edendale Place
- 0 Earl Ct
- 2380 Loma Vista Place
- 2586 Lake View Ave
- 2635 Adelbert Ave
- 2066 El Moran St
- 2214 Oak Glen Place
- 2377 Teviot St St
- 2371 Teviot St
- 2381 Teviot St
- 2387 Teviot St
- 2367 Teviot St
- 2370 Teviot St
- 2372 Glendale Blvd
- 2372 Glendale Blvd Unit 2372
- 2370 Glendale Blvd
- 2391 Teviot St
- 2365 Teviot St
- 2391 Teviot St
- 2384 Teviot St
- 2310 Brier Ave
- 2357 Teviot St
- 2397 Teviot St
- 2366 Glendale Blvd
- 2390 Teviot St
- 2376 Teviot St
- 2380 Teviot St