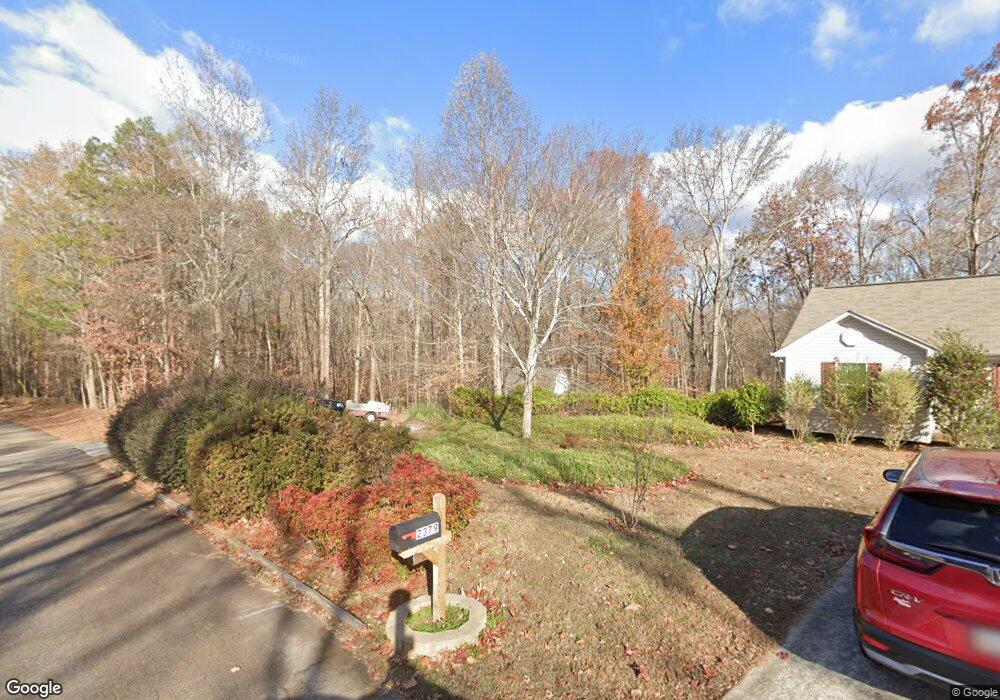
2379 Pine Grove Rd Unit A Gainesville, GA 30507
Estimated Value: $299,000 - $377,000
3
Beds
2
Baths
1,426
Sq Ft
$245/Sq Ft
Est. Value
About This Home
This home is located at 2379 Pine Grove Rd Unit A, Gainesville, GA 30507 and is currently estimated at $348,932, approximately $244 per square foot. 2379 Pine Grove Rd Unit A is a home located in Hall County with nearby schools including South Hall Middle School, Johnson High School, and Jubilee Christian Academy.
Ownership History
Date
Name
Owned For
Owner Type
Purchase Details
Closed on
May 20, 2015
Sold by
Saylor Theodore
Bought by
Farr Preston L
Current Estimated Value
Home Financials for this Owner
Home Financials are based on the most recent Mortgage that was taken out on this home.
Original Mortgage
$141,839
Outstanding Balance
$112,047
Interest Rate
4.4%
Mortgage Type
FHA
Estimated Equity
$236,885
Purchase Details
Closed on
Sep 3, 2014
Sold by
Johnson Eulalie K
Bought by
Saylor Theodore Johnson Eulalie and Saylor Theodore
Purchase Details
Closed on
Sep 21, 2006
Sold by
Lanman Homes Inc
Bought by
Johnson Eulalie Kie
Home Financials for this Owner
Home Financials are based on the most recent Mortgage that was taken out on this home.
Original Mortgage
$146,400
Interest Rate
6.25%
Mortgage Type
New Conventional
Create a Home Valuation Report for This Property
The Home Valuation Report is an in-depth analysis detailing your home's value as well as a comparison with similar homes in the area
Home Values in the Area
Average Home Value in this Area
Purchase History
| Date | Buyer | Sale Price | Title Company |
|---|---|---|---|
| Farr Preston L | $164,000 | -- | |
| Farr Preston L | $164,000 | -- | |
| Saylor Theodore Johnson Eulalie | -- | -- | |
| Johnson Eulalie Kie | $183,100 | -- |
Source: Public Records
Mortgage History
| Date | Status | Borrower | Loan Amount |
|---|---|---|---|
| Open | Farr Preston L | $141,839 | |
| Closed | Farr Preston L | $141,839 | |
| Previous Owner | Johnson Eulalie Kie | $146,400 |
Source: Public Records
Tax History Compared to Growth
Tax History
| Year | Tax Paid | Tax Assessment Tax Assessment Total Assessment is a certain percentage of the fair market value that is determined by local assessors to be the total taxable value of land and additions on the property. | Land | Improvement |
|---|---|---|---|---|
| 2024 | $3,446 | $136,640 | $35,480 | $101,160 |
| 2023 | $2,798 | $110,360 | $14,200 | $96,160 |
| 2022 | $2,421 | $91,200 | $14,200 | $77,000 |
| 2021 | $2,288 | $84,440 | $14,200 | $70,240 |
| 2020 | $2,266 | $81,160 | $14,200 | $66,960 |
| 2019 | $2,157 | $76,440 | $14,200 | $62,240 |
| 2018 | $1,842 | $62,776 | $14,200 | $48,576 |
| 2017 | $1,823 | $62,776 | $14,200 | $48,576 |
| 2016 | $1,780 | $62,776 | $14,200 | $48,576 |
| 2015 | -- | $62,776 | $14,200 | $48,576 |
| 2014 | -- | $62,776 | $14,200 | $48,576 |
Source: Public Records
Map
Nearby Homes
- 2350 Pine Grove Rd
- 0 Biscayne Place Unit 7600974
- 2371 E Dennis Dr
- 2857 Bullfrog Lane Lot 171
- 2664
- 2660 Lotus Landing Lot 36
- 2656 Lotus Landing Lot 35
- 2833 Bullfrog Ln Unit 177
- 2837 Bullfrog Ln Unit 176
- 2841 Bullfrog Ln Unit 175
- 2845 Bullfrog Ln Unit 174
- 2853 Bullfrog Ln Unit 172
- 2849 Bullfrog Ln Unit 173
- 2849
- 2853 Bullfrog Lane Lot 172
- 2845
- 2841 Bullfrog Lane Lot 175
- 2837 Bullfrog Lane Lot 176
- 3016 Orwell Dr
- 3114 Heritage Glen Dr
- 2379 Pine Grove Rd
- 2387 Pine Grove Rd
- 2362 Pine Grove Rd
- 0 Pine Grove Rd Unit 7325267
- 0 Pine Grove Rd Unit 7082367
- 0 Pine Grove Rd Unit 7315737
- 0 Pine Grove Rd Unit 3271993
- 0 Pine Grove Rd
- 2397 Pine Grove Rd
- 2368 Pine Grove Rd
- 2365 Pine Grove Rd
- 2359 Pine Grove Rd
- 2354 Pine Grove Rd
- 2355 Pine Grove Rd
- 2346 Pine Grove Rd
- 2349 Pine Grove Rd
- 2342 Pine Grove Rd
- 2398 Pine Grove Rd
- 2467 Athens Hwy
- 2343 Pine Grove Rd