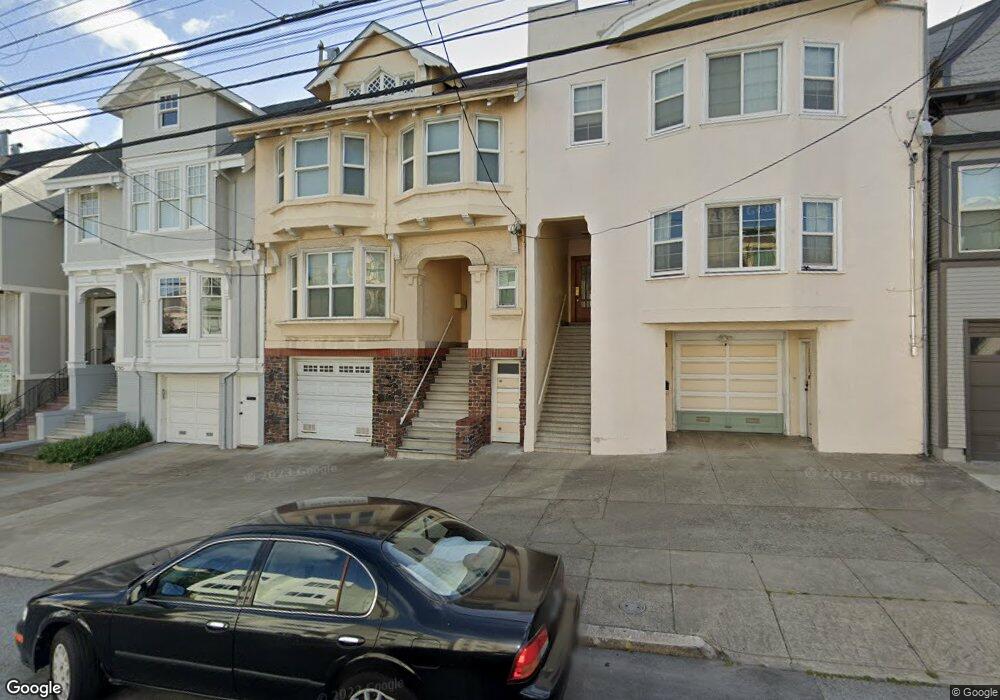
238 11th Ave Unit 240 San Francisco, CA 94118
Inner Richmond NeighborhoodEstimated Value: $1,579,000 - $2,253,855
--
Bed
2
Baths
2,900
Sq Ft
$656/Sq Ft
Est. Value
About This Home
This home is located at 238 11th Ave Unit 240, San Francisco, CA 94118 and is currently estimated at $1,902,464, approximately $656 per square foot. 238 11th Ave Unit 240 is a home located in San Francisco County with nearby schools including Sutro Elementary School, Roosevelt Middle School, and Stratford School - San Francisco 14th Avenue.
Ownership History
Date
Name
Owned For
Owner Type
Purchase Details
Closed on
Feb 5, 2021
Sold by
Tsang Chuck Kee and Tsang Chung Yee
Bought by
Tsang Wilfred Jung and Tsang Evelyn Soo
Current Estimated Value
Purchase Details
Closed on
Feb 8, 2003
Sold by
Tsang Chuck Kee and Tsang Chung Yee
Bought by
Tsang Chuck Kee and Tsang Chung Yee
Purchase Details
Closed on
Feb 3, 2003
Sold by
Tsang Chuck Kee and Tsang Chung Yee
Bought by
Tsang Chuck Kee and Tsang Chung Yee
Create a Home Valuation Report for This Property
The Home Valuation Report is an in-depth analysis detailing your home's value as well as a comparison with similar homes in the area
Home Values in the Area
Average Home Value in this Area
Purchase History
| Date | Buyer | Sale Price | Title Company |
|---|---|---|---|
| Tsang Wilfred Jung | -- | None Available | |
| Tsang Chuck Kee | -- | -- | |
| Tsang Chuck Kee | -- | -- |
Source: Public Records
Tax History Compared to Growth
Tax History
| Year | Tax Paid | Tax Assessment Tax Assessment Total Assessment is a certain percentage of the fair market value that is determined by local assessors to be the total taxable value of land and additions on the property. | Land | Improvement |
|---|---|---|---|---|
| 2025 | $3,564 | $298,808 | $72,388 | $226,420 |
| 2024 | $3,564 | $292,956 | $70,972 | $221,984 |
| 2023 | $3,514 | $287,216 | $69,584 | $217,632 |
| 2022 | $3,372 | $281,691 | $68,270 | $213,421 |
| 2021 | $3,314 | $276,169 | $66,932 | $209,237 |
| 2020 | $3,372 | $273,338 | $66,246 | $207,092 |
| 2019 | $3,260 | $267,980 | $64,948 | $203,032 |
| 2018 | $3,149 | $262,726 | $63,675 | $199,051 |
| 2017 | $3,112 | $257,576 | $62,427 | $195,149 |
| 2016 | $3,032 | $252,526 | $61,203 | $191,323 |
| 2015 | $2,992 | $248,734 | $60,284 | $188,450 |
| 2014 | $2,914 | $243,863 | $59,104 | $184,759 |
Source: Public Records
Map
Nearby Homes