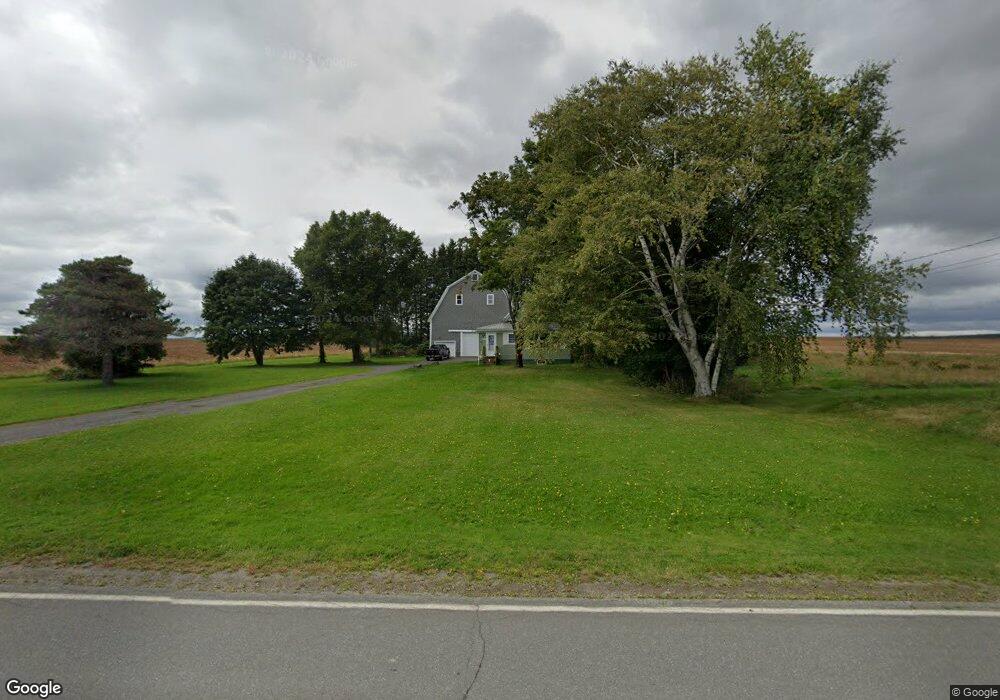
238 Hughes Rd Mapleton, ME 04757
Estimated Value: $172,000 - $250,000
3
Beds
1
Bath
1,586
Sq Ft
$123/Sq Ft
Est. Value
About This Home
This home is located at 238 Hughes Rd, Mapleton, ME 04757 and is currently estimated at $194,945, approximately $122 per square foot. 238 Hughes Rd is a home located in Aroostook County with nearby schools including Presque Isle Middle School and Presque Isle High School.
Ownership History
Date
Name
Owned For
Owner Type
Purchase Details
Closed on
Jun 24, 2021
Sold by
Johnson Edwin P and Johnson Cindy M
Bought by
Golding Arey B and Golding Lisa
Current Estimated Value
Home Financials for this Owner
Home Financials are based on the most recent Mortgage that was taken out on this home.
Original Mortgage
$152,000
Outstanding Balance
$137,617
Interest Rate
2.9%
Mortgage Type
Purchase Money Mortgage
Estimated Equity
$57,328
Create a Home Valuation Report for This Property
The Home Valuation Report is an in-depth analysis detailing your home's value as well as a comparison with similar homes in the area
Purchase History
| Date | Buyer | Sale Price | Title Company |
|---|---|---|---|
| Golding Arey B | -- | None Available |
Source: Public Records
Mortgage History
| Date | Status | Borrower | Loan Amount |
|---|---|---|---|
| Open | Golding Arey B | $152,000 |
Source: Public Records
Tax History
| Year | Tax Paid | Tax Assessment Tax Assessment Total Assessment is a certain percentage of the fair market value that is determined by local assessors to be the total taxable value of land and additions on the property. | Land | Improvement |
|---|---|---|---|---|
| 2024 | $2,038 | $162,400 | $28,300 | $134,100 |
| 2023 | $1,927 | $135,200 | $28,300 | $106,900 |
| 2022 | $1,584 | $98,100 | $18,700 | $79,400 |
| 2021 | $1,584 | $98,100 | $18,700 | $79,400 |
| 2020 | $257 | $98,100 | $18,700 | $79,400 |
| 2019 | $1,570 | $98,100 | $18,700 | $79,400 |
| 2018 | $1,545 | $97,800 | $18,500 | $79,300 |
| 2017 | $245 | $97,600 | $18,300 | $79,300 |
| 2016 | $1,532 | $97,600 | $18,300 | $79,300 |
| 2015 | $1,444 | $97,600 | $18,300 | $79,300 |
| 2014 | $1,454 | $97,600 | $18,300 | $79,300 |
| 2013 | $1,415 | $97,600 | $18,300 | $79,300 |
Source: Public Records
Map
Nearby Homes
- 228 Waddell Rd
- 40 Fords Ln
- 183 Pulcifur Rd
- 1776 Main St
- 1616 Main St
- 3091 W Chapman Rd
- Lot 7 Off Pulcifer Rd
- 707 Hughes Rd
- 1421 State Rd
- M2 L39-1 Pease Rd
- 459 Griffin Ridge Rd
- B McDonald Rd
- C McDonald Rd
- E McDonald Rd
- M8-L16 Grendell Rd
- 0 Carvell Rd
- 673 Mapleton Rd
- 1053 Washburn Rd
- 1027 Gardner Creek Rd
- 281 Cross Rd
Your Personal Tour Guide
Ask me questions while you tour the home.