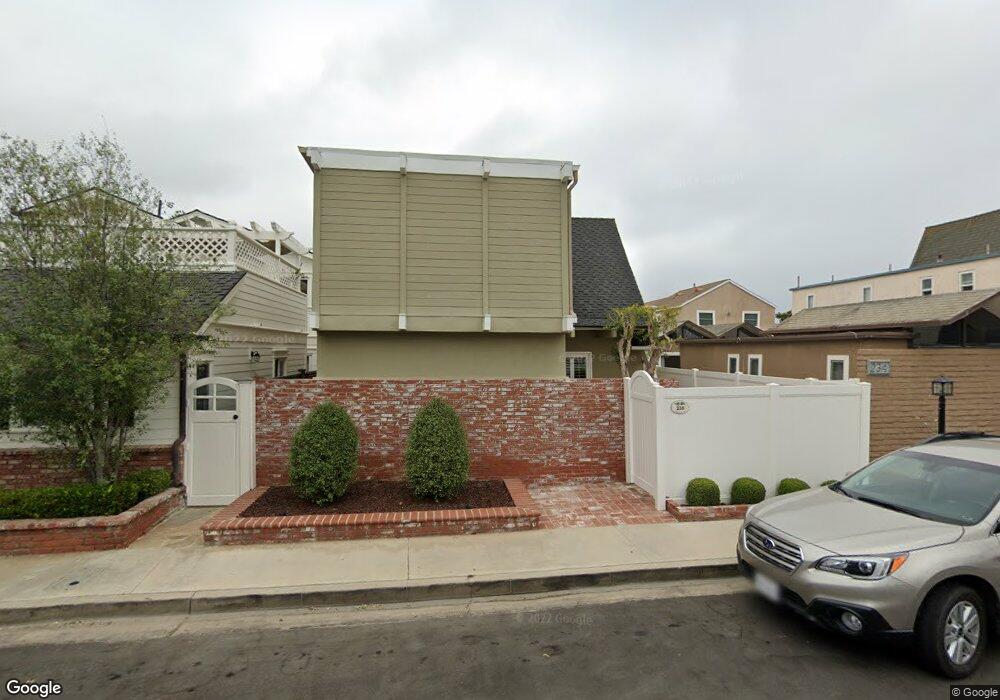
238 Walnut St Newport Beach, CA 92663
West Newport Beach NeighborhoodEstimated Value: $2,178,000 - $2,699,000
4
Beds
3
Baths
1,719
Sq Ft
$1,465/Sq Ft
Est. Value
About This Home
This home is located at 238 Walnut St, Newport Beach, CA 92663 and is currently estimated at $2,518,947, approximately $1,465 per square foot. 238 Walnut St is a home located in Orange County with nearby schools including Newport Elementary School, Horace Ensign Intermediate School, and Newport Harbor High School.
Ownership History
Date
Name
Owned For
Owner Type
Purchase Details
Closed on
Dec 14, 2002
Sold by
Barber James D and Barber Susan M
Bought by
Barber James Dale and Barber Susan Marie
Current Estimated Value
Purchase Details
Closed on
Feb 7, 2001
Sold by
Kilfoy Mary and Johnson Patricia
Bought by
Barber James D and Barber Susan M
Home Financials for this Owner
Home Financials are based on the most recent Mortgage that was taken out on this home.
Original Mortgage
$230,000
Interest Rate
6.98%
Purchase Details
Closed on
Sep 1, 2000
Sold by
Kilfoy Mary and Johnson Patricia
Bought by
Kilfoy Mary and Johnson Patricia
Purchase Details
Closed on
Jun 16, 2000
Sold by
Peck Christine A
Bought by
Peck Christine E and Christine Eleanor Ahlgren Peck Trust
Create a Home Valuation Report for This Property
The Home Valuation Report is an in-depth analysis detailing your home's value as well as a comparison with similar homes in the area
Home Values in the Area
Average Home Value in this Area
Purchase History
| Date | Buyer | Sale Price | Title Company |
|---|---|---|---|
| Barber James Dale | -- | -- | |
| Barber James D | $438,000 | Stewart Title | |
| Kilfoy Mary | -- | -- | |
| Peck Christine E | -- | -- |
Source: Public Records
Mortgage History
| Date | Status | Borrower | Loan Amount |
|---|---|---|---|
| Closed | Barber James D | $230,000 |
Source: Public Records
Tax History
| Year | Tax Paid | Tax Assessment Tax Assessment Total Assessment is a certain percentage of the fair market value that is determined by local assessors to be the total taxable value of land and additions on the property. | Land | Improvement |
|---|---|---|---|---|
| 2025 | $7,128 | $659,991 | $537,664 | $122,327 |
| 2024 | $7,128 | $647,050 | $527,121 | $119,929 |
| 2023 | $6,957 | $634,363 | $516,785 | $117,578 |
| 2022 | $6,836 | $621,925 | $506,652 | $115,273 |
| 2021 | $6,706 | $609,731 | $496,718 | $113,013 |
| 2020 | $6,640 | $603,479 | $491,624 | $111,855 |
| 2019 | $6,507 | $591,647 | $481,985 | $109,662 |
| 2018 | $6,378 | $580,047 | $472,535 | $107,512 |
| 2017 | $6,265 | $568,674 | $463,270 | $105,404 |
| 2016 | $6,125 | $557,524 | $454,186 | $103,338 |
| 2015 | $6,065 | $549,150 | $447,364 | $101,786 |
| 2014 | $5,921 | $538,393 | $438,600 | $99,793 |
Source: Public Records
Map
Nearby Homes
- 331 Walnut St
- 7104 W Oceanfront
- 7210 W Oceanfront
- 5512 Seashore Dr
- 5201 Seashore Dr
- 5007 Seashore Dr
- 307 Columbia St
- 10 Serena Ct Unit 27
- 4704 Seashore Dr
- 126 47th St Unit 1
- 1684 Whittier Ave Unit 20
- 1660 Whittier Ave Unit 17
- 1660 Whittier Ave Unit 18
- 1789 Nantucket Place
- 903 W 17th St Unit 16
- 200 Paris Ln Unit 111
- 4403 W Coast Hwy Unit 2
- 1750 Whittier Ave Unit 87
- 130 43rd St
- 220 Nice Ln Unit 215
Your Personal Tour Guide
Ask me questions while you tour the home.