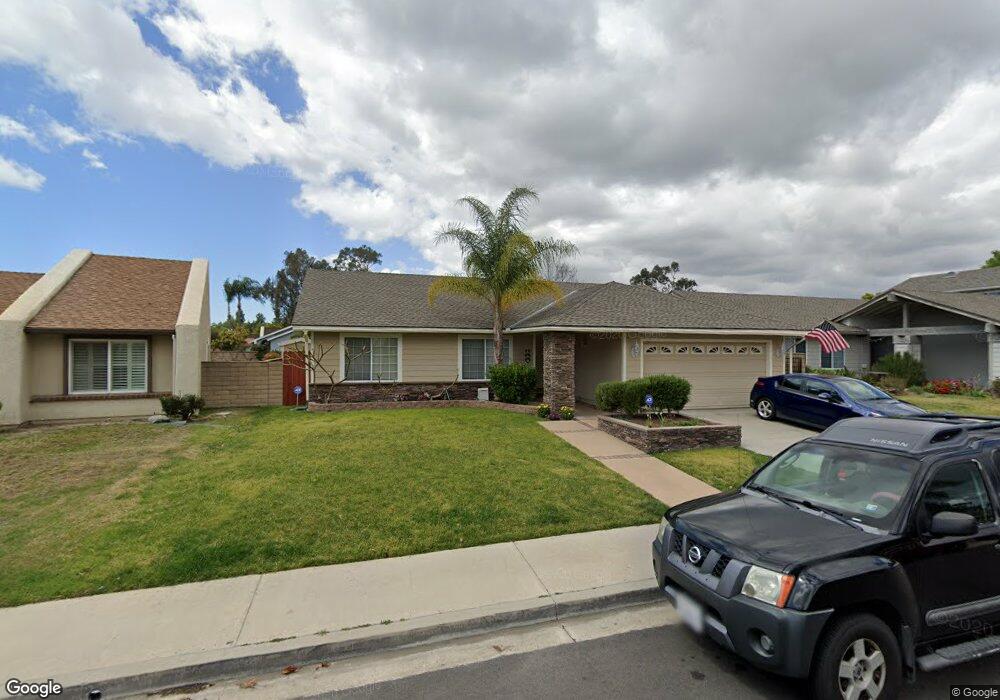
23811 Via el Rocio Mission Viejo, CA 92691
Estimated Value: $1,127,000 - $1,304,000
3
Beds
2
Baths
1,546
Sq Ft
$774/Sq Ft
Est. Value
About This Home
This home is located at 23811 Via el Rocio, Mission Viejo, CA 92691 and is currently estimated at $1,196,097, approximately $773 per square foot. 23811 Via el Rocio is a home located in Orange County with nearby schools including Castille Elementary School, Newhart Middle School, and Capistrano Valley High School.
Ownership History
Date
Name
Owned For
Owner Type
Purchase Details
Closed on
Dec 14, 2023
Sold by
Lorilei Virginia Clary Trust
Bought by
Lorilei Virginia Clary Trust and Clary
Current Estimated Value
Home Financials for this Owner
Home Financials are based on the most recent Mortgage that was taken out on this home.
Original Mortgage
$580,000
Outstanding Balance
$570,843
Interest Rate
7.76%
Mortgage Type
New Conventional
Estimated Equity
$625,254
Purchase Details
Closed on
Dec 8, 2023
Sold by
Lorilei Virginia Clary Trust
Bought by
Lorilei Virginia Clary Trust and Clary
Home Financials for this Owner
Home Financials are based on the most recent Mortgage that was taken out on this home.
Original Mortgage
$580,000
Outstanding Balance
$570,843
Interest Rate
7.76%
Mortgage Type
New Conventional
Estimated Equity
$625,254
Purchase Details
Closed on
Dec 6, 2023
Sold by
Clary Wade P
Bought by
Lorilei Virginia Clary Trust and Clary
Home Financials for this Owner
Home Financials are based on the most recent Mortgage that was taken out on this home.
Original Mortgage
$580,000
Outstanding Balance
$570,843
Interest Rate
7.76%
Mortgage Type
New Conventional
Estimated Equity
$625,254
Purchase Details
Closed on
Mar 26, 2013
Sold by
Clary Wade P and Clapp Lorilei
Bought by
Clary Wade P and Clary Lorilei
Home Financials for this Owner
Home Financials are based on the most recent Mortgage that was taken out on this home.
Original Mortgage
$387,500
Interest Rate
3.49%
Mortgage Type
New Conventional
Purchase Details
Closed on
Apr 17, 2009
Sold by
Clapp Lorilei V
Bought by
Clary Wade P and Clapp Lorilei
Home Financials for this Owner
Home Financials are based on the most recent Mortgage that was taken out on this home.
Original Mortgage
$408,000
Interest Rate
5.02%
Mortgage Type
New Conventional
Purchase Details
Closed on
Feb 26, 2007
Sold by
Clapp Kevin S
Bought by
Clapp Lorilei
Home Financials for this Owner
Home Financials are based on the most recent Mortgage that was taken out on this home.
Original Mortgage
$416,000
Interest Rate
6.6%
Mortgage Type
Purchase Money Mortgage
Purchase Details
Closed on
Jan 22, 1999
Sold by
Seaholm Lorilei V and Seaholm Lorilei V
Bought by
Clapp Kevin S
Home Financials for this Owner
Home Financials are based on the most recent Mortgage that was taken out on this home.
Original Mortgage
$199,000
Interest Rate
6.63%
Create a Home Valuation Report for This Property
The Home Valuation Report is an in-depth analysis detailing your home's value as well as a comparison with similar homes in the area
Home Values in the Area
Average Home Value in this Area
Purchase History
| Date | Buyer | Sale Price | Title Company |
|---|---|---|---|
| Lorilei Virginia Clary Trust | -- | Chicago Title Company | |
| Lorilei Virginia Clary Trust | -- | Chicago Title Company | |
| Lorilei Virginia Clary Trust | -- | Chicago Title Company | |
| Lorilei Virginia Clary Trust | -- | Chicago Title Company | |
| Clary Wade P | -- | Wfg Title Company Of Ca | |
| Clary Wade P | -- | First American Title Company | |
| Clapp Lorilei | -- | Fidelity Natl Title Mclpc | |
| Clapp Kevin S | -- | Commonwealth Land Title |
Source: Public Records
Mortgage History
| Date | Status | Borrower | Loan Amount |
|---|---|---|---|
| Open | Lorilei Virginia Clary Trust | $580,000 | |
| Closed | Lorilei Virginia Clary Trust | $580,000 | |
| Previous Owner | Clary Wade P | $387,500 | |
| Previous Owner | Clary Wade P | $408,000 | |
| Previous Owner | Clapp Lorilei | $416,000 | |
| Previous Owner | Clapp Kevin S | $199,000 |
Source: Public Records
Tax History Compared to Growth
Tax History
| Year | Tax Paid | Tax Assessment Tax Assessment Total Assessment is a certain percentage of the fair market value that is determined by local assessors to be the total taxable value of land and additions on the property. | Land | Improvement |
|---|---|---|---|---|
| 2025 | $3,855 | $386,619 | $253,152 | $133,467 |
| 2024 | $3,855 | $379,039 | $248,189 | $130,850 |
| 2023 | $3,702 | $371,607 | $243,322 | $128,285 |
| 2022 | $3,631 | $364,321 | $238,551 | $125,770 |
| 2021 | $3,559 | $357,178 | $233,874 | $123,304 |
| 2020 | $3,523 | $353,516 | $231,476 | $122,040 |
| 2019 | $3,453 | $346,585 | $226,937 | $119,648 |
| 2018 | $3,385 | $339,790 | $222,488 | $117,302 |
| 2017 | $3,318 | $333,128 | $218,126 | $115,002 |
| 2016 | $3,253 | $326,597 | $213,849 | $112,748 |
| 2015 | $3,219 | $321,692 | $210,637 | $111,055 |
| 2014 | $3,156 | $315,391 | $206,511 | $108,880 |
Source: Public Records
Map
Nearby Homes
- 27301 Via Avila
- 27241 Via Burgos
- 26702 Via Linares
- 23431 Via Guadix
- 26655 Avenida Deseo
- 23336 Via Bahia
- 27382 Via Cortez
- 23662 Via San Gil
- 24202 Carrillo Dr
- 23266 Via Ronda
- 23382 Via Chiripa
- 26812 Via Llano
- 24392 Macedo Dr
- 23251 Via Guadix
- 23502 Coso Unit 193
- 23641 Coronel Dr
- 24102 Castilla Ln
- 27705 Via Rodrigo
- 26862 Salazar Dr
- 24362 Via Santa Clara
- 23791 Via el Rocio
- 23821 Via el Rocio
- 23802 Via la Coruna
- 23782 Via la Coruna
- 23781 Via el Rocio
- 23831 Via el Rocio
- 23812 Via la Coruna
- 23772 Via la Coruna
- 23822 Via el Rocio
- 23812 Via el Rocio
- 23771 Via el Rocio
- 23792 Via el Rocio
- 23832 Via el Rocio
- 23841 Via el Rocio
- 23762 Via la Coruna
- 23782 Via el Rocio
- 23842 Via la Coruna
- 23842 Via el Rocio
- 23761 Via el Rocio
- 23772 Via el Rocio