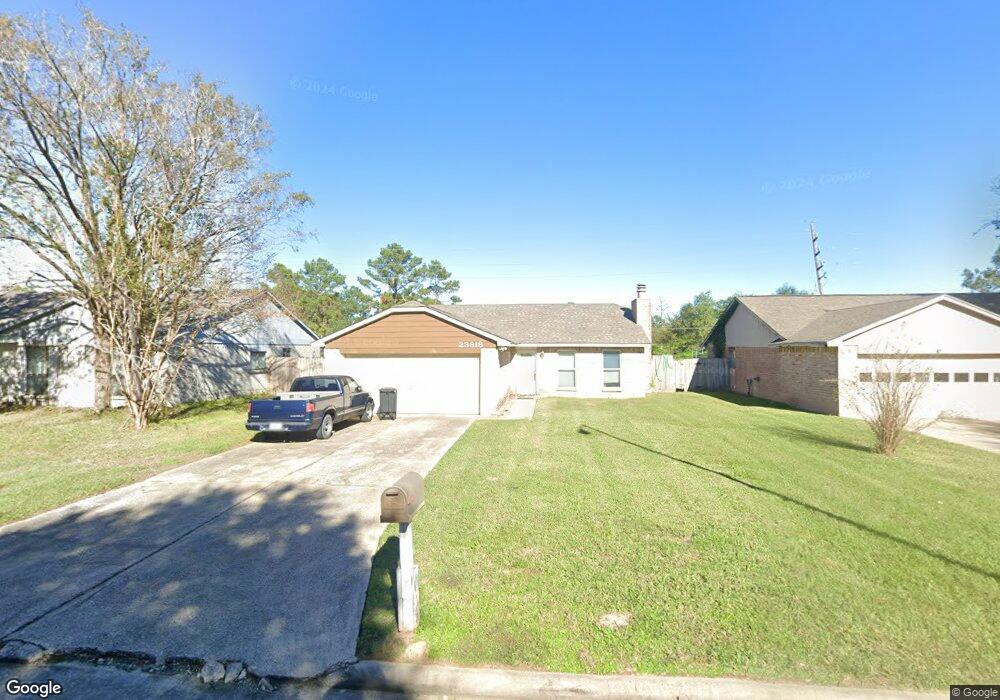
23818 Firegate Dr Spring, TX 77373
Estimated Value: $180,623 - $202,000
3
Beds
2
Baths
1,280
Sq Ft
$149/Sq Ft
Est. Value
About This Home
This home is located at 23818 Firegate Dr, Spring, TX 77373 and is currently estimated at $190,156, approximately $148 per square foot. 23818 Firegate Dr is a home located in Harris County with nearby schools including Mildred Jenkins Elementary School, Dueitt Middle School, and Spring High School.
Ownership History
Date
Name
Owned For
Owner Type
Purchase Details
Closed on
Jun 17, 2009
Sold by
Cable Debbie Lynn
Bought by
Cable Lawrence Leroy
Current Estimated Value
Purchase Details
Closed on
Feb 18, 2004
Sold by
Cable Lawrence L
Bought by
Cable Lawrence L and Cable Debbie L
Home Financials for this Owner
Home Financials are based on the most recent Mortgage that was taken out on this home.
Original Mortgage
$67,000
Outstanding Balance
$31,073
Interest Rate
5.67%
Mortgage Type
New Conventional
Estimated Equity
$159,083
Purchase Details
Closed on
Nov 4, 1996
Sold by
Berener Albert
Bought by
Cable Lawrence L
Home Financials for this Owner
Home Financials are based on the most recent Mortgage that was taken out on this home.
Original Mortgage
$43,302
Interest Rate
8.17%
Mortgage Type
FHA
Create a Home Valuation Report for This Property
The Home Valuation Report is an in-depth analysis detailing your home's value as well as a comparison with similar homes in the area
Home Values in the Area
Average Home Value in this Area
Purchase History
| Date | Buyer | Sale Price | Title Company |
|---|---|---|---|
| Cable Lawrence Leroy | -- | None Available | |
| Cable Lawrence L | -- | -- | |
| Cable Lawrence L | -- | Commonwealth Land Title Co |
Source: Public Records
Mortgage History
| Date | Status | Borrower | Loan Amount |
|---|---|---|---|
| Open | Cable Lawrence L | $67,000 | |
| Closed | Cable Lawrence L | $43,302 | |
| Closed | Cable Lawrence Leroy | $0 |
Source: Public Records
Tax History
| Year | Tax Paid | Tax Assessment Tax Assessment Total Assessment is a certain percentage of the fair market value that is determined by local assessors to be the total taxable value of land and additions on the property. | Land | Improvement |
|---|---|---|---|---|
| 2025 | $4,291 | $156,761 | $37,985 | $118,776 |
| 2024 | $4,291 | $171,442 | $37,985 | $133,457 |
| 2023 | $4,291 | $188,944 | $37,985 | $150,959 |
| 2022 | $4,231 | $171,957 | $15,194 | $156,763 |
| 2021 | $3,544 | $135,947 | $15,194 | $120,753 |
| 2020 | $3,301 | $118,576 | $15,194 | $103,382 |
| 2019 | $3,483 | $120,740 | $9,724 | $111,016 |
| 2018 | $3,325 | $110,096 | $9,724 | $100,372 |
| 2017 | $3,141 | $110,096 | $9,724 | $100,372 |
| 2016 | $2,700 | $94,653 | $9,724 | $84,929 |
| 2015 | $2,382 | $94,653 | $9,724 | $84,929 |
| 2014 | $2,382 | $82,177 | $9,724 | $72,453 |
Source: Public Records
Map
Nearby Homes
- 23815 Firegate Dr
- 4815 Hickorygate Dr
- 4515 Mossygate Dr
- 4811 Tealgate Dr
- 24022 Rockygate Dr
- 4827 Tealgate Dr
- 4407 Quailgate Dr
- 4423 Mossygate Dr
- 4918 Quailgate Dr
- 23615 Lady Capulet Dr
- 23827 Lestergate Dr
- 4919 Tealgate Dr
- 4803 Blue Jacaranda Way
- 4831 Blue Jacaranda Way
- 4431 Enchantedgate Dr
- 4927 Blue Jacaranda Way
- 23663 Rainbow Eucalyptus Dr
- 4318 Burkegate Dr
- 4251 Mossygate Dr
- 23430 Wintergate Dr
- 23814 Firegate Dr
- 23822 Firegate Dr
- 23810 Firegate Dr
- 23826 Firegate Dr
- 23806 Firegate Dr
- 23830 Firegate Dr
- 23819 Firegate Dr
- 23823 Firegate Dr
- 23811 Firegate Dr
- 23802 Firegate Dr
- 23834 Firegate Dr
- 4634 Tealgate Dr
- 4635 Hickorygate Dr
- 23819 Floragate Dr
- 23815 Floragate Dr
- 23823 Floragate Dr
- 4626 Quailgate Dr
- 23811 Floragate Dr
- 4630 Tealgate Dr
- 23827 Floragate Dr
Your Personal Tour Guide
Ask me questions while you tour the home.