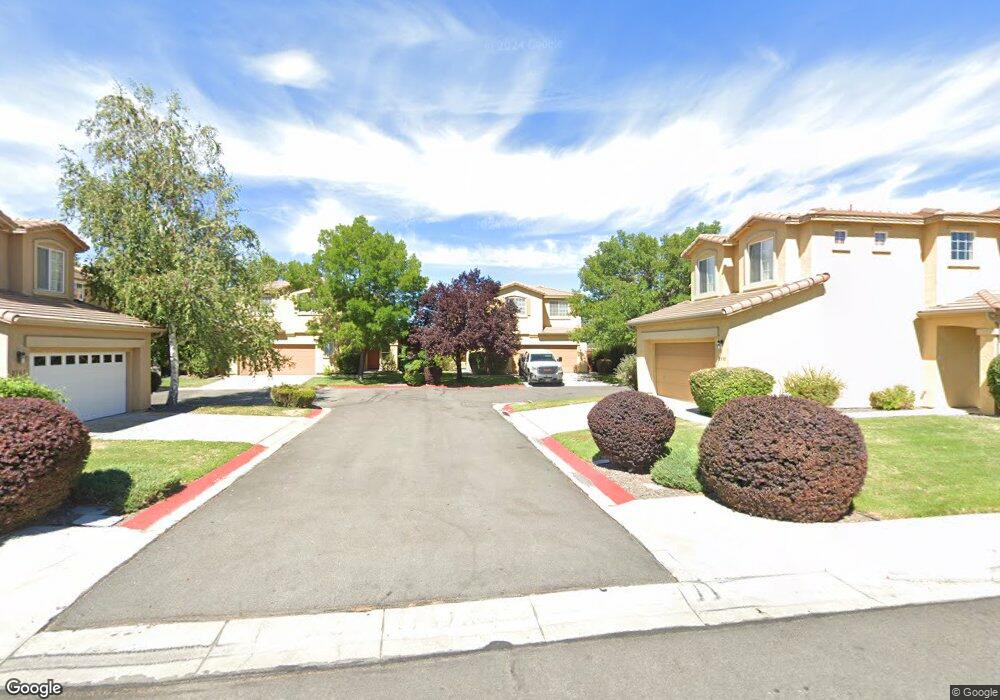
2383 Napoli Dr Sparks, NV 89434
D'Andrea NeighborhoodEstimated Value: $415,000 - $463,000
3
Beds
3
Baths
1,643
Sq Ft
$273/Sq Ft
Est. Value
About This Home
This home is located at 2383 Napoli Dr, Sparks, NV 89434 and is currently estimated at $448,391, approximately $272 per square foot. 2383 Napoli Dr is a home located in Washoe County with nearby schools including Marvin Moss Elementary School, Lou Mendive Middle School, and Edward C Reed High School.
Ownership History
Date
Name
Owned For
Owner Type
Purchase Details
Closed on
Sep 20, 2011
Sold by
Rittiman Brandon R and Rittiman Brandon Ross
Bought by
Rittiman Brandon R and Rittiman Elizabeth L
Current Estimated Value
Home Financials for this Owner
Home Financials are based on the most recent Mortgage that was taken out on this home.
Original Mortgage
$139,900
Outstanding Balance
$95,104
Interest Rate
4.26%
Mortgage Type
New Conventional
Estimated Equity
$353,287
Purchase Details
Closed on
Dec 3, 2008
Sold by
Homesales Inc
Bought by
Rittiman Brandon Ross
Home Financials for this Owner
Home Financials are based on the most recent Mortgage that was taken out on this home.
Original Mortgage
$138,800
Interest Rate
6.47%
Mortgage Type
Unknown
Purchase Details
Closed on
Nov 14, 2008
Sold by
Federal National Mortgage Association
Bought by
Homesales Inc
Home Financials for this Owner
Home Financials are based on the most recent Mortgage that was taken out on this home.
Original Mortgage
$138,800
Interest Rate
6.47%
Mortgage Type
Unknown
Purchase Details
Closed on
Aug 22, 2007
Sold by
Jpmorgan Chase Bank Na
Bought by
Federal National Mortgage Association
Purchase Details
Closed on
Jul 24, 2007
Sold by
Chase Home Finance Llc
Bought by
Federal National Mortgage Association
Purchase Details
Closed on
Jun 15, 2007
Sold by
Johns Ling
Bought by
Jpmorgan Chase Bank Na and Jpmorgan Chase Bank
Purchase Details
Closed on
Nov 20, 2003
Sold by
Johns Gerald
Bought by
Johns Ling
Home Financials for this Owner
Home Financials are based on the most recent Mortgage that was taken out on this home.
Original Mortgage
$177,200
Interest Rate
5.25%
Mortgage Type
Unknown
Purchase Details
Closed on
Oct 24, 2003
Sold by
Kim Sun O
Bought by
Johns Ling
Home Financials for this Owner
Home Financials are based on the most recent Mortgage that was taken out on this home.
Original Mortgage
$177,200
Interest Rate
5.25%
Mortgage Type
Unknown
Purchase Details
Closed on
Feb 19, 2003
Sold by
Kim Kwang R and Kim Sun O
Bought by
Kim Sun O
Purchase Details
Closed on
Oct 10, 2001
Sold by
Coleman Siena Llc
Bought by
Kim Kwang R and Kim Sun O
Home Financials for this Owner
Home Financials are based on the most recent Mortgage that was taken out on this home.
Original Mortgage
$144,400
Interest Rate
6.91%
Create a Home Valuation Report for This Property
The Home Valuation Report is an in-depth analysis detailing your home's value as well as a comparison with similar homes in the area
Home Values in the Area
Average Home Value in this Area
Purchase History
| Date | Buyer | Sale Price | Title Company |
|---|---|---|---|
| Rittiman Brandon R | -- | First American Title Sparks | |
| Rittiman Brandon Ross | $173,500 | Ticor Title Reno | |
| Homesales Inc | $173,500 | Ticor Title Reno | |
| Federal National Mortgage Association | -- | First American Title | |
| Federal National Mortgage Association | -- | First American Title | |
| Jpmorgan Chase Bank Na | $264,518 | Accommodation | |
| Johns Ling | -- | Stewart Title Of Northern Nv | |
| Johns Ling | $605,433 | Stewart Title Of Northern Nv | |
| Kim Sun O | -- | -- | |
| Kim Kwang R | $161,500 | Inter County Title Co |
Source: Public Records
Mortgage History
| Date | Status | Borrower | Loan Amount |
|---|---|---|---|
| Open | Rittiman Brandon R | $139,900 | |
| Closed | Rittiman Brandon Ross | $138,800 | |
| Previous Owner | Johns Ling | $177,200 | |
| Previous Owner | Kim Kwang R | $144,400 |
Source: Public Records
Tax History
| Year | Tax Paid | Tax Assessment Tax Assessment Total Assessment is a certain percentage of the fair market value that is determined by local assessors to be the total taxable value of land and additions on the property. | Land | Improvement |
|---|---|---|---|---|
| 2026 | $1,776 | $93,233 | $26,432 | $66,801 |
| 2024 | $2,307 | $92,035 | $23,294 | $68,741 |
| 2023 | $2,240 | $91,868 | $26,864 | $65,004 |
| 2022 | $2,175 | $77,061 | $22,997 | $54,065 |
| 2021 | $2,113 | $71,767 | $17,924 | $53,843 |
| 2020 | $1,984 | $74,285 | $20,286 | $53,999 |
| 2019 | $1,890 | $70,688 | $18,396 | $52,292 |
| 2018 | $1,803 | $64,207 | $13,041 | $51,166 |
| 2017 | $1,699 | $62,614 | $12,348 | $50,266 |
| 2016 | $1,656 | $62,412 | $11,120 | $51,292 |
| 2015 | $1,653 | $60,943 | $9,923 | $51,020 |
| 2014 | $1,601 | $52,693 | $8,537 | $44,156 |
| 2013 | -- | $42,882 | $6,650 | $36,232 |
Source: Public Records
Map
Nearby Homes
- 2199 Lucca Ln
- 1759 Veneto Dr
- 1741 Medolla Dr
- 2854 Cintoia Dr
- 2152 Wabash Cir
- 2264 Fernwood Ct
- 1750 Corleone Dr
- 2688 Laguna Way
- 2485 Firenze Dr
- 2600 Anqua Ct
- 2227 Valencia Way
- 3142 Jarbidge Way
- 2624 Sunny Slope Dr Unit 10
- 2625 Sunny Slope Dr
- 2625 Sunny Slope Dr Unit 2
- 2627 Sunny Slope Dr Unit 5
- 1695 Atlantic Way
- 2407 Sunny Slope Dr Unit 1
- 2140 Burnside Dr
- 2507 Sycamore Glen Dr Unit 5
- 2383 Napoli Dr Unit 1
- 2377 Napoli Dr
- 2395 Napoli Dr Unit 1
- 2389 Napoli Dr
- 2371 Napoli Dr
- 2413 Napoli Dr
- 2365 Napoli Dr
- 2405 Napoli Dr Unit 2
- 2421 Napoli Dr Unit 2
- 2349 Napoli Dr Unit 1
- 2343 Napoli Dr
- 2355 Napoli Dr
- 2366 Napoli Dr
- 2429 Napoli Dr
- 2396 Napoli Dr Unit 1
- 2445 Napoli Dr
- 2437 Napoli Dr
- 2337 Napoli Dr
- 2406 Napoli Dr Unit 2
- 2378 Napoli Dr Unit 1
Your Personal Tour Guide
Ask me questions while you tour the home.