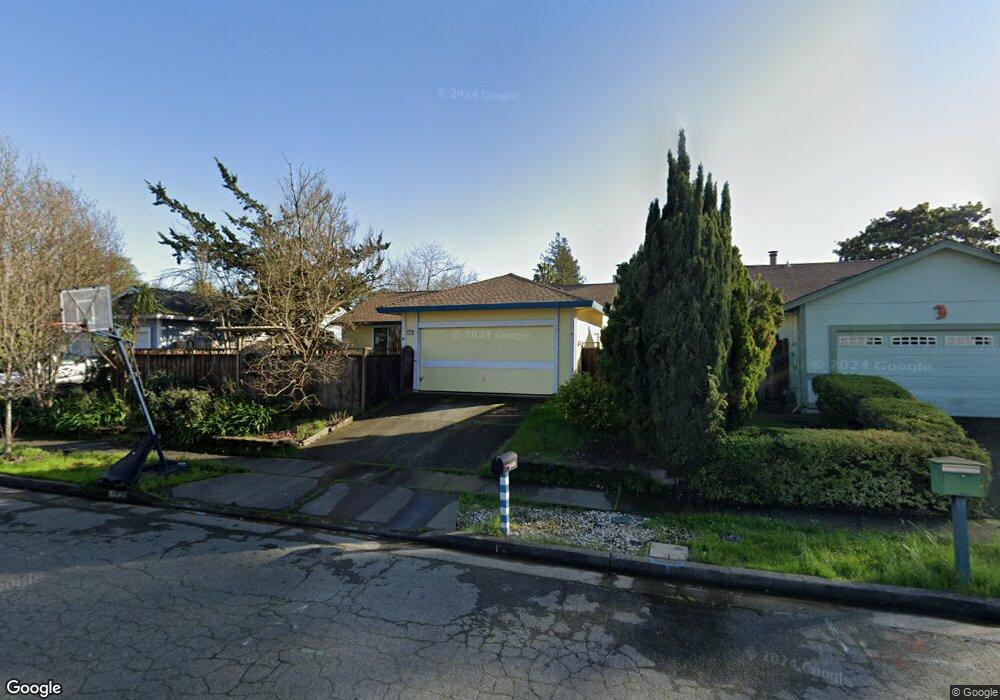
2384 Julio Ln Santa Rosa, CA 95401
Copperfield NeighborhoodEstimated Value: $614,566 - $655,000
3
Beds
2
Baths
1,240
Sq Ft
$515/Sq Ft
Est. Value
About This Home
This home is located at 2384 Julio Ln, Santa Rosa, CA 95401 and is currently estimated at $638,392, approximately $514 per square foot. 2384 Julio Ln is a home located in Sonoma County with nearby schools including Elsie Allen High School, Wright Charter, and College Oak Montessori School.
Ownership History
Date
Name
Owned For
Owner Type
Purchase Details
Closed on
Jul 19, 2024
Sold by
Michael Ronan James and Mejia Marcela
Bought by
James And Marcela Trust and Ronan
Current Estimated Value
Purchase Details
Closed on
Jun 23, 2004
Sold by
Mejia Ronan James M and Mejia Ronan Marcela
Bought by
Mejia Ronan James M and Mejia Ronan Marcela
Home Financials for this Owner
Home Financials are based on the most recent Mortgage that was taken out on this home.
Original Mortgage
$256,000
Interest Rate
6.27%
Mortgage Type
New Conventional
Purchase Details
Closed on
Mar 5, 2001
Sold by
Henry Sean B and Henry Debra A
Bought by
Mejia Ronan James M and Mejia Ronan Marcel A
Home Financials for this Owner
Home Financials are based on the most recent Mortgage that was taken out on this home.
Original Mortgage
$251,750
Interest Rate
7.11%
Create a Home Valuation Report for This Property
The Home Valuation Report is an in-depth analysis detailing your home's value as well as a comparison with similar homes in the area
Home Values in the Area
Average Home Value in this Area
Purchase History
| Date | Buyer | Sale Price | Title Company |
|---|---|---|---|
| James And Marcela Trust | -- | None Listed On Document | |
| Mejia Ronan James M | -- | First American Title Co | |
| Mejia Ronan James M | $265,000 | North American Title Co |
Source: Public Records
Mortgage History
| Date | Status | Borrower | Loan Amount |
|---|---|---|---|
| Previous Owner | Mejia Ronan James M | $256,000 | |
| Previous Owner | Mejia Ronan James M | $251,750 |
Source: Public Records
Tax History Compared to Growth
Tax History
| Year | Tax Paid | Tax Assessment Tax Assessment Total Assessment is a certain percentage of the fair market value that is determined by local assessors to be the total taxable value of land and additions on the property. | Land | Improvement |
|---|---|---|---|---|
| 2025 | $4,454 | $399,301 | $210,954 | $188,347 |
| 2024 | $4,454 | $391,472 | $206,818 | $184,654 |
| 2023 | $4,454 | $383,797 | $202,763 | $181,034 |
| 2022 | $4,201 | $376,273 | $198,788 | $177,485 |
| 2021 | $4,124 | $368,896 | $194,891 | $174,005 |
| 2020 | $4,108 | $365,114 | $192,893 | $172,221 |
| 2019 | $4,070 | $357,956 | $189,111 | $168,845 |
| 2018 | $4,039 | $350,938 | $185,403 | $165,535 |
| 2017 | $3,955 | $344,058 | $181,768 | $162,290 |
| 2016 | $3,917 | $337,312 | $178,204 | $159,108 |
| 2015 | $3,790 | $332,247 | $175,528 | $156,719 |
| 2014 | $3,026 | $271,000 | $143,000 | $128,000 |
Source: Public Records
Map
Nearby Homes
- 2353 Hood Ct
- 2400 Valley Dr W
- 2333 Pacheco Place
- 438 Rusty Dr
- 91 Westgate Cir
- 337 Westmont Place
- 415 Occidental Cir
- 2315 Cross Ave
- 2305 Cross Ave
- 213 Monarch Ct
- 307 Occidental Cir
- 224 Regency Ct
- 314 Michael Dr
- 226 Regency Ct
- 235 Regency Ct
- 234 Arboleda Dr
- 28 Westgate Cir
- 23 Westgate Cir
- 948 Brunello Dr
- 2154 Longhorn Cir