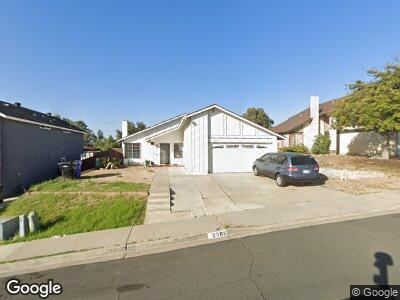
2388 Montcliff Rd San Diego, CA 92139
Bay Terraces NeighborhoodEstimated Value: $702,000 - $811,000
4
Beds
2
Baths
1,607
Sq Ft
$483/Sq Ft
Est. Value
About This Home
This home is located at 2388 Montcliff Rd, San Diego, CA 92139 and is currently estimated at $776,971, approximately $483 per square foot. 2388 Montcliff Rd is a home located in San Diego County with nearby schools including Zamorano Elementary School, Bell Middle School, and Morse High School.
Ownership History
Date
Name
Owned For
Owner Type
Purchase Details
Closed on
Sep 23, 2008
Sold by
Fdic
Bought by
Ramos Edgar L and Ramos Feliza D
Current Estimated Value
Home Financials for this Owner
Home Financials are based on the most recent Mortgage that was taken out on this home.
Original Mortgage
$288,562
Interest Rate
6.31%
Mortgage Type
FHA
Purchase Details
Closed on
May 2, 2008
Sold by
Magana Jorge
Bought by
Indymac Bank Fsb
Purchase Details
Closed on
Dec 27, 2006
Sold by
Pham Jimmy Huy Nhat
Bought by
Magana Jorge
Home Financials for this Owner
Home Financials are based on the most recent Mortgage that was taken out on this home.
Original Mortgage
$448,000
Interest Rate
8%
Mortgage Type
Unknown
Purchase Details
Closed on
Jul 8, 2004
Sold by
Realce Victor A and Realce Belen G
Bought by
Pham Jimmy Huy Nhat
Home Financials for this Owner
Home Financials are based on the most recent Mortgage that was taken out on this home.
Original Mortgage
$344,000
Interest Rate
5%
Mortgage Type
Unknown
Create a Home Valuation Report for This Property
The Home Valuation Report is an in-depth analysis detailing your home's value as well as a comparison with similar homes in the area
Home Values in the Area
Average Home Value in this Area
Purchase History
| Date | Buyer | Sale Price | Title Company |
|---|---|---|---|
| Ramos Edgar L | $300,000 | Chicago Title Company | |
| Indymac Bank Fsb | $351,745 | Fidelity National Title | |
| Magana Jorge | $560,000 | Commonwealth Land Title Co | |
| Pham Jimmy Huy Nhat | $430,000 | Stewart Title |
Source: Public Records
Mortgage History
| Date | Status | Borrower | Loan Amount |
|---|---|---|---|
| Open | Ramos Edgar L | $268,500 | |
| Closed | Ramos Edgar L | $26,844 | |
| Closed | Ramos Edgar L | $19,762 | |
| Closed | Ramos Edgar L | $288,562 | |
| Previous Owner | Magana Jorge | $448,000 | |
| Previous Owner | Pham Jimmy Huy Nhat | $344,000 | |
| Previous Owner | Realce Victor A | $25,000 | |
| Closed | Pham Jimmy Huy Nhat | $42,950 |
Source: Public Records
Tax History Compared to Growth
Tax History
| Year | Tax Paid | Tax Assessment Tax Assessment Total Assessment is a certain percentage of the fair market value that is determined by local assessors to be the total taxable value of land and additions on the property. | Land | Improvement |
|---|---|---|---|---|
| 2024 | $4,600 | $378,735 | $183,055 | $195,680 |
| 2023 | $4,497 | $371,310 | $179,466 | $191,844 |
| 2022 | $4,376 | $364,031 | $175,948 | $188,083 |
| 2021 | $4,344 | $356,895 | $172,499 | $184,396 |
| 2020 | $4,291 | $353,237 | $170,731 | $182,506 |
| 2019 | $4,213 | $346,312 | $167,384 | $178,928 |
| 2018 | $3,938 | $339,522 | $164,102 | $175,420 |
| 2017 | $81 | $332,866 | $160,885 | $171,981 |
| 2016 | $3,780 | $326,340 | $157,731 | $168,609 |
| 2015 | $3,723 | $321,439 | $155,362 | $166,077 |
| 2014 | $3,663 | $315,143 | $152,319 | $162,824 |
Source: Public Records
Map
Nearby Homes
- 2336 Spring Oak Way
- 2920 Briarwood Rd Unit C15
- 2920 Briarwood Rd Unit B1
- 2920 Briarwood Rd Unit K13
- 2920 Briarwood Rd Unit D11
- 2294 Barney St
- 2963 Plaza Carlos
- 3037 Plaza Lorenzo
- 3011 Plaza Alonzo
- 3069 Plaza Natalia
- 5218 Monet Ln
- 3020 Plaza Lorenzo
- 3024 Plaza Natalia
- 3089 Picasso Dr
- 5359 Robinwood Rd
- 3131 Casa Bonita Dr
- 7040 Tenbury Ct
- 7837 Goode St
- 6919 Sandleford Way
- 1889 Manzana Way Unit 4
- 2388 Montcliff Rd
- 2384 Montcliff Rd
- 2394 Montcliff Rd
- 2378 Montcliff Rd
- 3505 Alta View Dr
- 3533 Alta View Dr
- 2374 Montcliff Rd
- 2381 Montcliff Rd
- 2385 Montcliff Rd
- 2377 Montcliff Rd
- 7396 Tooma St Unit 193
- 7396 Tooma St Unit 194
- 7336 Tooma St
- 7336 Tooma St Unit 244
- 7336 Tooma St Unit 243
- 7312 Tooma St Unit 254
- 7312 Tooma St Unit 253
- 7350 Tooma St Unit 180
- 7350 Tooma St Unit 179
- 2389 Montcliff Rd