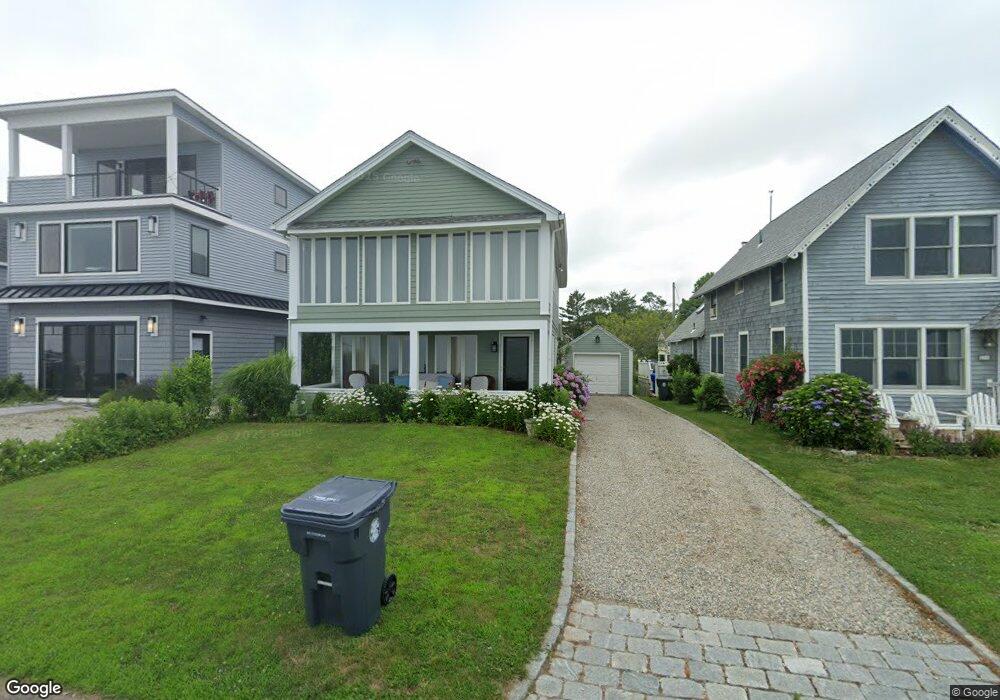
239 Linden Ave Branford, CT 06405
Estimated Value: $975,000 - $1,303,000
4
Beds
7
Baths
1,694
Sq Ft
$687/Sq Ft
Est. Value
About This Home
This home is located at 239 Linden Ave, Branford, CT 06405 and is currently estimated at $1,164,473, approximately $687 per square foot. 239 Linden Ave is a home located in New Haven County with nearby schools including Francis Walsh Intermediate School, Branford High School, and East Shoreline Catholic Academy.
Ownership History
Date
Name
Owned For
Owner Type
Purchase Details
Closed on
Mar 30, 2004
Sold by
Jacobs Richard A and Jacobs Gail M
Bought by
Poirier Andre and Criscuolo Debra M
Current Estimated Value
Home Financials for this Owner
Home Financials are based on the most recent Mortgage that was taken out on this home.
Original Mortgage
$1,087,500
Outstanding Balance
$450,549
Interest Rate
3.96%
Estimated Equity
$713,924
Purchase Details
Closed on
Apr 3, 1987
Sold by
Hartenstein Rbt W
Bought by
Summit Properties
Home Financials for this Owner
Home Financials are based on the most recent Mortgage that was taken out on this home.
Original Mortgage
$243,750
Interest Rate
9.11%
Create a Home Valuation Report for This Property
The Home Valuation Report is an in-depth analysis detailing your home's value as well as a comparison with similar homes in the area
Home Values in the Area
Average Home Value in this Area
Purchase History
| Date | Buyer | Sale Price | Title Company |
|---|---|---|---|
| Poirier Andre | $1,450,000 | -- | |
| Summit Properties | $325,000 | -- |
Source: Public Records
Mortgage History
| Date | Status | Borrower | Loan Amount |
|---|---|---|---|
| Open | Summit Properties | $1,087,500 | |
| Previous Owner | Summit Properties | $243,750 |
Source: Public Records
Tax History Compared to Growth
Tax History
| Year | Tax Paid | Tax Assessment Tax Assessment Total Assessment is a certain percentage of the fair market value that is determined by local assessors to be the total taxable value of land and additions on the property. | Land | Improvement |
|---|---|---|---|---|
| 2025 | $18,231 | $851,900 | $649,100 | $202,800 |
| 2024 | $16,258 | $533,400 | $406,900 | $126,500 |
| 2023 | $15,943 | $533,400 | $406,900 | $126,500 |
| 2022 | $15,709 | $533,400 | $406,900 | $126,500 |
| 2021 | $15,709 | $533,400 | $406,900 | $126,500 |
| 2020 | $15,426 | $533,400 | $406,900 | $126,500 |
| 2019 | $15,567 | $535,500 | $406,900 | $128,600 |
| 2018 | $15,337 | $535,500 | $406,900 | $128,600 |
| 2017 | $15,246 | $535,500 | $406,900 | $128,600 |
| 2016 | $14,678 | $535,500 | $406,900 | $128,600 |
| 2015 | $14,421 | $535,500 | $406,900 | $128,600 |
| 2014 | $13,970 | $532,400 | $406,900 | $125,500 |
Source: Public Records
Map
Nearby Homes
- 10 Montgomery Pkwy
- 94 Summer Island Rd
- 3 Bayview Ave
- 13 Fenway Rd
- 40 Linden Shores
- 15 River Rd
- 21 Harbor St
- 42 Waverly Rd
- 76 Limewood Ave
- 74 Quarry Dock Rd
- 58 Quarry Dock Rd
- 2 W Haycock Point Rd
- 66 Turtle Bay Dr Unit 66
- 74 Turtle Bay Dr Unit 74
- 90 Turtle Bay Dr
- 62 S Montowese St
- 29 Harbour Village Unit D
- 60 Maple St Unit 40B
- 29 Seaview Ave
- 22 Rock Pasture Rd