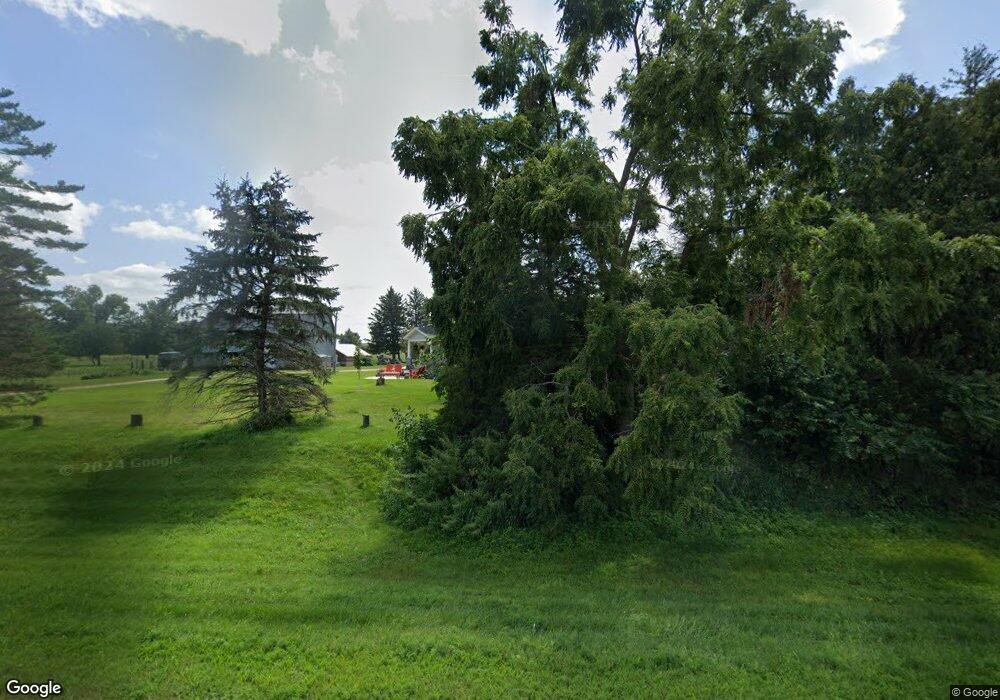
2390 110th St Stanley, IA 50671
Estimated Value: $78,000 - $346,000
5
Beds
2
Baths
1,876
Sq Ft
$137/Sq Ft
Est. Value
About This Home
This home is located at 2390 110th St, Stanley, IA 50671 and is currently estimated at $257,568, approximately $137 per square foot. 2390 110th St is a home located in Buchanan County with nearby schools including Little Husky Learning Center, Wings Park Elementary School, and Parkside Elementary School.
Ownership History
Date
Name
Owned For
Owner Type
Purchase Details
Closed on
Aug 27, 2025
Sold by
Wharram Robert L and Wharram Peggy J
Bought by
Eike Brandon J and Eike Ann M
Current Estimated Value
Home Financials for this Owner
Home Financials are based on the most recent Mortgage that was taken out on this home.
Original Mortgage
$205,218
Outstanding Balance
$205,041
Interest Rate
6.75%
Mortgage Type
New Conventional
Estimated Equity
$52,527
Purchase Details
Closed on
Sep 18, 2013
Sold by
Wharram Robert L and Wharram Peggy J
Bought by
Eike Brandon J and Eike Ann M
Home Financials for this Owner
Home Financials are based on the most recent Mortgage that was taken out on this home.
Original Mortgage
$184,103
Interest Rate
4.12%
Mortgage Type
FHA
Purchase Details
Closed on
Sep 11, 2013
Sold by
Hayes Joan A
Bought by
Wharram Robert L and Wharram Peggy J
Home Financials for this Owner
Home Financials are based on the most recent Mortgage that was taken out on this home.
Original Mortgage
$184,103
Interest Rate
4.12%
Mortgage Type
FHA
Create a Home Valuation Report for This Property
The Home Valuation Report is an in-depth analysis detailing your home's value as well as a comparison with similar homes in the area
Purchase History
| Date | Buyer | Sale Price | Title Company |
|---|---|---|---|
| Eike Brandon J | $168,000 | None Listed On Document | |
| Eike Brandon J | $187,500 | None Available | |
| Wharram Robert L | $168,000 | None Available |
Source: Public Records
Mortgage History
| Date | Status | Borrower | Loan Amount |
|---|---|---|---|
| Open | Eike Brandon J | $205,218 | |
| Previous Owner | Eike Brandon J | $184,103 |
Source: Public Records
Tax History
| Year | Tax Paid | Tax Assessment Tax Assessment Total Assessment is a certain percentage of the fair market value that is determined by local assessors to be the total taxable value of land and additions on the property. | Land | Improvement |
|---|---|---|---|---|
| 2025 | $2,554 | $270,320 | $54,000 | $216,320 |
| 2024 | $2,554 | $220,760 | $44,720 | $176,040 |
| 2023 | $2,492 | $220,760 | $44,720 | $176,040 |
| 2022 | $2,278 | $173,360 | $35,750 | $137,610 |
| 2021 | $2,302 | $173,360 | $35,750 | $137,610 |
| 2020 | $2,302 | $162,280 | $32,500 | $129,780 |
| 2019 | $2,200 | $162,280 | $32,500 | $129,780 |
| 2018 | $2,042 | $157,220 | $32,500 | $124,720 |
| 2017 | $1,950 | $157,220 | $32,500 | $124,720 |
| 2016 | $1,942 | $148,238 | $21,420 | $126,818 |
| 2015 | $1,942 | $150,678 | $21,420 | $129,258 |
| 2014 | $1,970 | $150,678 | $21,420 | $129,258 |
Source: Public Records
Map
Nearby Homes
- 1097 Slater Ave
- 100 Hawkeye St
- 1963 118th St
- 2039 140th St
- 203 Benton St E
- 1528 Lawrence Ave
- 1836 105th St
- 0 S Frederick & Wildwood Ln Unit NBR20254283
- 28 12th Ave SE
- 24 12th Ave SE
- 500 7th Ave SE
- 418 7th Ave SE
- 107 9th Ave SE
- 120 12th Ave NE
- 1108 3rd St NE
- 1215 3rd St NE
- 973 S Frederick Ave
- 111 8th St SE
- 229 4th Ave SE
- 15542 40th St
Your Personal Tour Guide
Ask me questions while you tour the home.