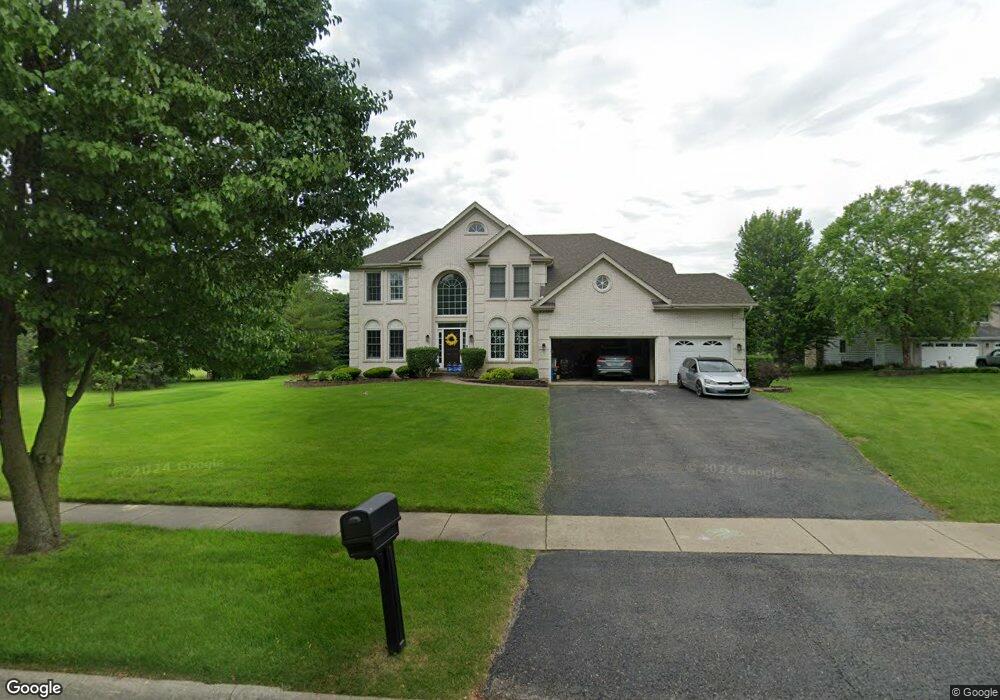
23921 W Pheasant Run Ct Naperville, IL 60564
Crestview Knoll NeighborhoodEstimated Value: $713,000 - $808,000
--
Bed
1
Bath
3,060
Sq Ft
$244/Sq Ft
Est. Value
About This Home
This home is located at 23921 W Pheasant Run Ct, Naperville, IL 60564 and is currently estimated at $746,778, approximately $244 per square foot. 23921 W Pheasant Run Ct is a home located in Will County with nearby schools including Oliver Julian Kendall Elementary School, Ellsworth Elementary School, and Clifford Crone Middle School.
Ownership History
Date
Name
Owned For
Owner Type
Purchase Details
Closed on
Mar 14, 2014
Sold by
Chander Mohan
Bought by
Chander Mohan and Chander Mandeep
Current Estimated Value
Home Financials for this Owner
Home Financials are based on the most recent Mortgage that was taken out on this home.
Original Mortgage
$277,200
Outstanding Balance
$204,218
Interest Rate
3.62%
Mortgage Type
Adjustable Rate Mortgage/ARM
Estimated Equity
$542,560
Purchase Details
Closed on
Dec 4, 1998
Sold by
The Krughoff Company
Bought by
Chander Mohan and Chander Indira Rani
Home Financials for this Owner
Home Financials are based on the most recent Mortgage that was taken out on this home.
Original Mortgage
$170,000
Interest Rate
6.93%
Purchase Details
Closed on
Oct 22, 1997
Sold by
Midwest Trust Services Inc
Bought by
Garcia Colleen J
Home Financials for this Owner
Home Financials are based on the most recent Mortgage that was taken out on this home.
Original Mortgage
$110,000
Interest Rate
7.32%
Create a Home Valuation Report for This Property
The Home Valuation Report is an in-depth analysis detailing your home's value as well as a comparison with similar homes in the area
Home Values in the Area
Average Home Value in this Area
Purchase History
| Date | Buyer | Sale Price | Title Company |
|---|---|---|---|
| Chander Mohan | -- | Citywide Title Corporation | |
| Chander Mohan | $295,000 | -- | |
| Garcia Colleen J | $301,000 | -- |
Source: Public Records
Mortgage History
| Date | Status | Borrower | Loan Amount |
|---|---|---|---|
| Open | Chander Mohan | $277,200 | |
| Closed | Chander Mohan | $170,000 | |
| Previous Owner | Garcia Colleen J | $110,000 |
Source: Public Records
Tax History Compared to Growth
Tax History
| Year | Tax Paid | Tax Assessment Tax Assessment Total Assessment is a certain percentage of the fair market value that is determined by local assessors to be the total taxable value of land and additions on the property. | Land | Improvement |
|---|---|---|---|---|
| 2024 | $12,728 | $203,345 | $44,185 | $159,160 |
| 2023 | $12,728 | $179,634 | $39,033 | $140,601 |
| 2022 | $12,291 | $169,930 | $36,924 | $133,006 |
| 2021 | $11,261 | $161,838 | $35,166 | $126,672 |
| 2020 | $11,052 | $159,274 | $34,609 | $124,665 |
| 2019 | $10,858 | $154,786 | $33,634 | $121,152 |
| 2018 | $11,410 | $159,152 | $32,894 | $126,258 |
| 2017 | $11,259 | $155,044 | $32,045 | $122,999 |
| 2016 | $11,211 | $151,706 | $31,355 | $120,351 |
| 2015 | $11,137 | $145,871 | $30,149 | $115,722 |
| 2014 | $11,137 | $143,280 | $30,149 | $113,131 |
| 2013 | $11,137 | $143,280 | $30,149 | $113,131 |
Source: Public Records
Map
Nearby Homes
- 2711 Wait Rd
- 2255 Wendt Cir
- 11110 Highland Dr
- 29W316 Andermann Dr
- 3707 Junebreeze Ln
- 24531 W 103rd St
- 26106 W Sherwood Cir
- 23234 W Allagash Dr
- 11319 Maplewood Dr
- 3740 Ryder Ct
- 1736 Robert Ln
- 3432 Redwing Dr Unit 2
- 24024 W Champion Dr
- 1804 Princess Cir
- 3420 Sunnyside Ct
- 3423 Sunnyside Ct
- 3421 Goldfinch Dr
- 3281 Cool Springs Ct
- The Braxton Plan at Ashwood Heights
- 2547 Mallet Ct
- 23931 Pheasant Run Ct
- 23905 Pheasant Run Ct
- 10632 Grey Fox Trail
- 2651 Freeland Cir
- 23935 W Pheasant Run Ct
- 2655 Freeland Cir Unit 4
- 2647 Freeland Cir
- 23922 Pheasant Run Ct
- 2659 Freeland Cir Unit 4
- 2643 Freeland Cir Unit 4
- 23932 Pheasant Run Ct
- 10614 Grey Fox Trail
- 23928 Pheasant Run Ct
- 2663 Freeland Cir
- 10645 Grey Fox Trail
- 2631 Freeland Cir Unit 4
- 2656 Freeland Cir
- 10633 Grey Fox Trail
- 2652 Freeland Cir
- 10659 Grey Fox Trail