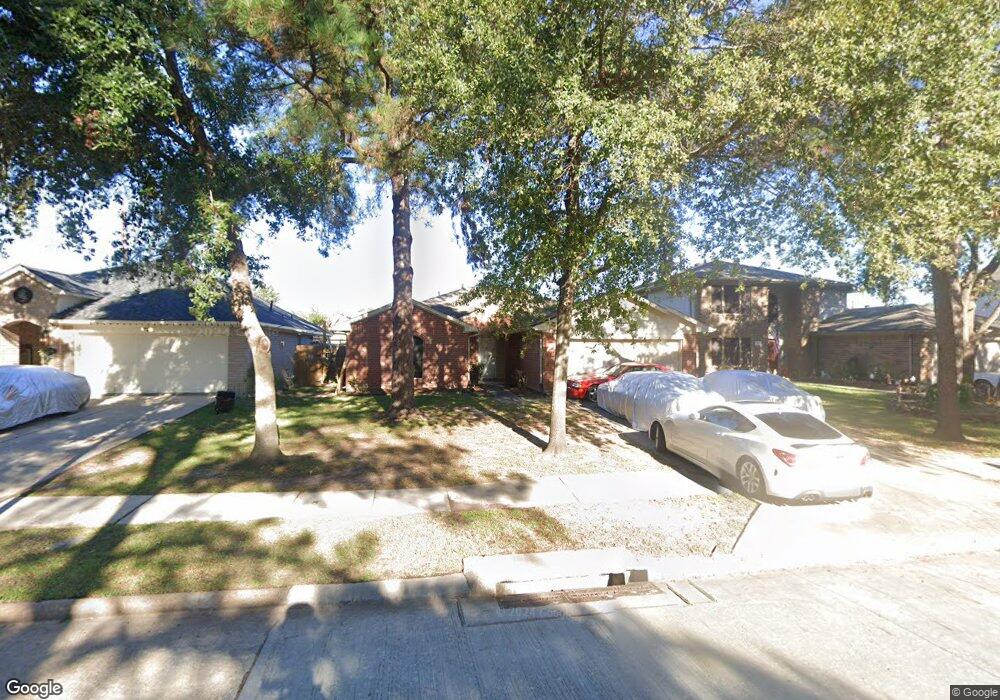
23926 Goodfellow Dr Spring, TX 77373
Estimated Value: $202,000 - $215,000
3
Beds
2
Baths
1,388
Sq Ft
$151/Sq Ft
Est. Value
About This Home
This home is located at 23926 Goodfellow Dr, Spring, TX 77373 and is currently estimated at $209,812, approximately $151 per square foot. 23926 Goodfellow Dr is a home located in Harris County with nearby schools including Chet Burchett Elementary School, Ricky C. Bailey Middle School, and Spring High School.
Ownership History
Date
Name
Owned For
Owner Type
Purchase Details
Closed on
Jun 24, 2009
Sold by
Jasek Brandon Todd and Jasek Donna Renee
Bought by
Colquitt Karen A
Current Estimated Value
Home Financials for this Owner
Home Financials are based on the most recent Mortgage that was taken out on this home.
Original Mortgage
$92,297
Outstanding Balance
$58,503
Interest Rate
4.83%
Mortgage Type
FHA
Estimated Equity
$151,309
Purchase Details
Closed on
Feb 27, 2003
Sold by
Showers George W and Lorraine Showers B
Bought by
Jasek Brandon Todd and Jasek Donna Renee
Home Financials for this Owner
Home Financials are based on the most recent Mortgage that was taken out on this home.
Original Mortgage
$86,782
Interest Rate
5.93%
Mortgage Type
FHA
Purchase Details
Closed on
Dec 29, 1993
Sold by
Mhi Partnership Ltd
Bought by
Showers George W and Lorraine Showers B
Create a Home Valuation Report for This Property
The Home Valuation Report is an in-depth analysis detailing your home's value as well as a comparison with similar homes in the area
Home Values in the Area
Average Home Value in this Area
Purchase History
| Date | Buyer | Sale Price | Title Company |
|---|---|---|---|
| Colquitt Karen A | -- | Stewart Title Houston Div | |
| Jasek Brandon Todd | -- | Commonwealth Land Title Co | |
| Showers George W | -- | -- |
Source: Public Records
Mortgage History
| Date | Status | Borrower | Loan Amount |
|---|---|---|---|
| Open | Colquitt Karen A | $92,297 | |
| Previous Owner | Jasek Brandon Todd | $86,782 |
Source: Public Records
Tax History
| Year | Tax Paid | Tax Assessment Tax Assessment Total Assessment is a certain percentage of the fair market value that is determined by local assessors to be the total taxable value of land and additions on the property. | Land | Improvement |
|---|---|---|---|---|
| 2025 | $3,664 | $214,464 | $37,916 | $176,548 |
| 2024 | $3,664 | $217,099 | $37,916 | $179,183 |
| 2023 | $3,664 | $234,572 | $37,916 | $196,656 |
| 2022 | $4,098 | $192,335 | $15,166 | $177,169 |
| 2021 | $3,946 | $151,390 | $15,166 | $136,224 |
| 2020 | $3,876 | $142,408 | $15,166 | $127,242 |
| 2019 | $3,653 | $130,021 | $15,166 | $114,855 |
| 2018 | $2,721 | $115,093 | $15,166 | $99,927 |
| 2017 | $3,242 | $115,093 | $15,166 | $99,927 |
| 2016 | $2,948 | $115,093 | $15,166 | $99,927 |
| 2015 | $2,135 | $104,230 | $15,166 | $89,064 |
| 2014 | $2,135 | $0 | $0 | $0 |
Source: Public Records
Map
Nearby Homes
- 23914 Goodfellow Dr
- 24039 Clipper Hill Ln
- 5026 Forest Hurst Dr
- 4919 Tealgate Dr
- 4911 Tealgate Dr
- 24039 Kentwood Springs Dr
- 4919 Hickorygate Dr
- 4827 Tealgate Dr
- 5110 Forest Terrace Dr
- 24046 Kentwood Springs Dr
- 4815 Hickorygate Dr
- 23815 Hilltop Canyon Ln
- 6067 Diamond Vista Ct
- 23663 Rainbow Eucalyptus Dr
- 23915 Floragate Dr
- 4831 Blue Jacaranda Way
- 5343 Tuscany Hills Ln
- 23639 Buttress Root Dr
- 23607 Mesquite Trail Ln
- 24222 Sandstone Valley Ln
- 24002 Goodfellow Dr
- 23922 Goodfellow Dr
- 24006 Goodfellow Dr
- 23918 Goodfellow Dr
- 24003 Blossom Crest Ln
- 23931 Blossom Crest Ln
- 23927 Blossom Crest Ln
- 24010 Goodfellow Dr
- 23923 Blossom Crest Ln
- 23927 Goodfellow Dr
- 24003 Goodfellow Dr
- 23923 Goodfellow Dr
- 24007 Blossom Crest Ln
- 24007 Goodfellow Dr
- 23919 Goodfellow Dr
- 24014 Goodfellow Dr
- 23910 Goodfellow Dr
- 24011 Goodfellow Dr
- 23915 Goodfellow Dr
- 24015 Blossom Crest Ln
Your Personal Tour Guide
Ask me questions while you tour the home.