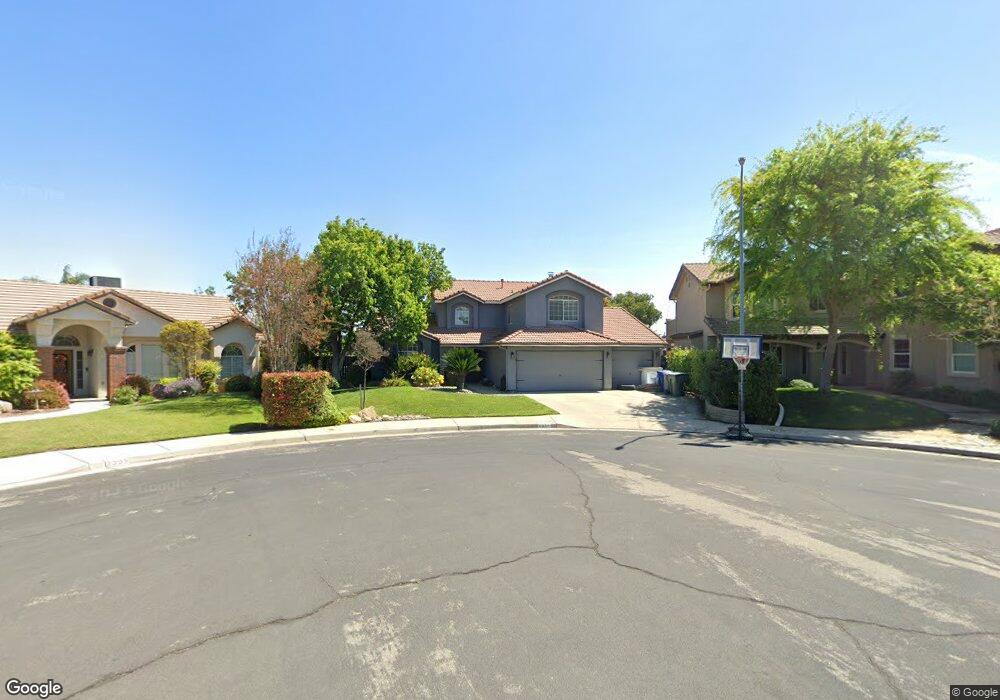
2394 Decatur Ave Clovis, CA 93611
Estimated Value: $617,000 - $642,000
4
Beds
3
Baths
2,276
Sq Ft
$277/Sq Ft
Est. Value
About This Home
This home is located at 2394 Decatur Ave, Clovis, CA 93611 and is currently estimated at $631,207, approximately $277 per square foot. 2394 Decatur Ave is a home located in Fresno County with nearby schools including Dry Creek Elementary School, Alta Sierra Intermediate School, and Buchanan High School.
Ownership History
Date
Name
Owned For
Owner Type
Purchase Details
Closed on
Jan 5, 2017
Sold by
Hewitt Devid
Bought by
Hewitt David M
Current Estimated Value
Purchase Details
Closed on
Jul 5, 2011
Sold by
Morris Robert D and Morris Heidemarie L
Bought by
Hewitt David
Purchase Details
Closed on
Jul 25, 2007
Sold by
Morris Robert D and Morris Heidemarie
Bought by
Morris Robert D and Morris Heidemarie L
Purchase Details
Closed on
Oct 26, 1994
Sold by
The Lovell Dyck Corp
Bought by
Morris Robert D and Morris Heidemarie
Home Financials for this Owner
Home Financials are based on the most recent Mortgage that was taken out on this home.
Original Mortgage
$172,300
Interest Rate
8.78%
Purchase Details
Closed on
Apr 25, 1994
Sold by
Threlkeld Thacher
Bought by
The Lovell Dyck Corp
Home Financials for this Owner
Home Financials are based on the most recent Mortgage that was taken out on this home.
Original Mortgage
$134,688
Interest Rate
7.79%
Create a Home Valuation Report for This Property
The Home Valuation Report is an in-depth analysis detailing your home's value as well as a comparison with similar homes in the area
Home Values in the Area
Average Home Value in this Area
Purchase History
| Date | Buyer | Sale Price | Title Company |
|---|---|---|---|
| Hewitt David M | -- | None Available | |
| Hewitt David | $256,000 | First American Title Company | |
| Morris Robert D | -- | None Available | |
| Morris Robert D | $191,500 | Stewart Title | |
| The Lovell Dyck Corp | $40,000 | Stewart Title |
Source: Public Records
Mortgage History
| Date | Status | Borrower | Loan Amount |
|---|---|---|---|
| Previous Owner | Morris Robert D | $172,300 | |
| Previous Owner | The Lovell Dyck Corp | $134,688 |
Source: Public Records
Tax History
| Year | Tax Paid | Tax Assessment Tax Assessment Total Assessment is a certain percentage of the fair market value that is determined by local assessors to be the total taxable value of land and additions on the property. | Land | Improvement |
|---|---|---|---|---|
| 2025 | $3,964 | $321,537 | $96,459 | $225,078 |
| 2023 | $3,805 | $309,053 | $92,714 | $216,339 |
| 2022 | $3,757 | $302,995 | $90,897 | $212,098 |
| 2021 | $3,635 | $297,055 | $89,115 | $207,940 |
| 2020 | $3,621 | $294,010 | $88,202 | $205,808 |
| 2019 | $3,554 | $288,246 | $86,473 | $201,773 |
| 2018 | $3,479 | $282,595 | $84,778 | $197,817 |
| 2017 | $3,422 | $277,055 | $83,116 | $193,939 |
| 2016 | $3,310 | $271,624 | $81,487 | $190,137 |
| 2015 | $3,248 | $267,544 | $80,263 | $187,281 |
| 2014 | $3,190 | $262,304 | $78,691 | $183,613 |
Source: Public Records
Map
Nearby Homes
- 2361 Cromwell Ave
- 971 N Filbert Ave
- 2117 Goshen Ave
- 878 N Ash Ave
- 1977 Goshen Ave
- 2670 Muncie Ave
- 2770 Muncie Ave
- 2643 Quincy Ave
- 1754 Decatur Ave
- 367 N Raphael Ln Unit 367
- 1 Ave
- 338 N Filbert Ave
- 8220 N Fowler Ave
- 2578 Warner Ave
- 2051 Los Altos Ave
- 1731 N Hanson Ave
- 7272 N Traverse Ave
- 1734 N Park Ave
- 2936 Trenton Ave
- 3091 Teague Ave
- 2393 Decatur Ave
- 2384 Decatur Ave
- 2374 Decatur Ave
- 2383 Decatur Ave
- 2396 Fallbrook Ave
- 957 N Joshua Ave
- 2386 Fallbrook Ave
- 2373 Decatur Ave
- 2376 Fallbrook Ave
- 947 N Joshua Ave
- 2395 Fallbrook Ave
- 2364 Decatur Ave
- 2366 Fallbrook Ave
- 2363 Decatur Ave
- 956 N Joshua Ave
- 2354 Decatur Ave
- 1026 N Joshua Ave
- 2385 Fallbrook Ave
- 946 N Joshua Ave
- 2375 Fallbrook Ave
Your Personal Tour Guide
Ask me questions while you tour the home.