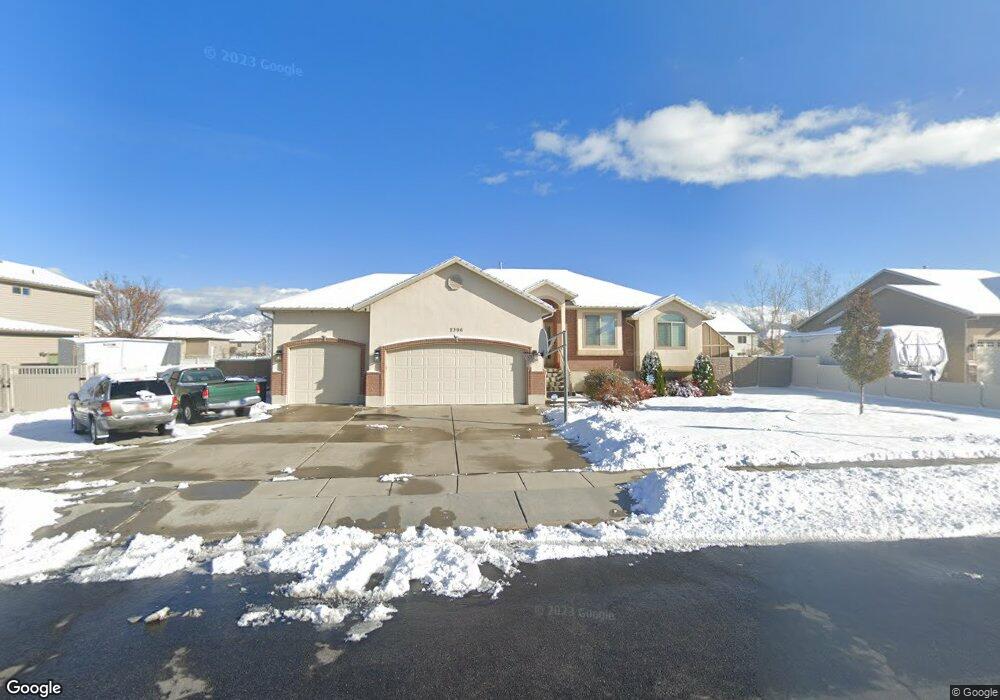
2396 N 2775 W Clearfield, UT 84015
Estimated Value: $535,000 - $569,000
3
Beds
3
Baths
3,000
Sq Ft
$184/Sq Ft
Est. Value
About This Home
This home is located at 2396 N 2775 W, Clearfield, UT 84015 and is currently estimated at $552,550, approximately $184 per square foot. 2396 N 2775 W is a home located in Davis County with nearby schools including West Clinton Elementary School, West Point Junior High School, and Clearfield High School.
Ownership History
Date
Name
Owned For
Owner Type
Purchase Details
Closed on
Mar 20, 2020
Sold by
Keeler Christopher
Bought by
Keeler Christopher and Keeler Natasha Paula
Current Estimated Value
Home Financials for this Owner
Home Financials are based on the most recent Mortgage that was taken out on this home.
Original Mortgage
$272,600
Outstanding Balance
$240,966
Interest Rate
3.4%
Mortgage Type
New Conventional
Estimated Equity
$311,584
Purchase Details
Closed on
Nov 13, 2017
Sold by
Keeler Christopher and Keeler Natasha
Bought by
Keeler Christopher
Home Financials for this Owner
Home Financials are based on the most recent Mortgage that was taken out on this home.
Original Mortgage
$260,000
Interest Rate
3.85%
Mortgage Type
New Conventional
Purchase Details
Closed on
Aug 11, 2014
Sold by
Hurst Joshua S and Hurst Brooke L
Bought by
Hurst Brooke L
Purchase Details
Closed on
Apr 23, 2008
Sold by
Alton Brian and Alton Shelly L
Bought by
Hurst Joshua S and Hurst Brooke L
Home Financials for this Owner
Home Financials are based on the most recent Mortgage that was taken out on this home.
Original Mortgage
$246,905
Interest Rate
5.81%
Mortgage Type
Purchase Money Mortgage
Purchase Details
Closed on
Aug 16, 2004
Sold by
Aspen Homes Development Inc
Bought by
Altom Brian and Altom Shelly L
Home Financials for this Owner
Home Financials are based on the most recent Mortgage that was taken out on this home.
Original Mortgage
$165,600
Interest Rate
5.97%
Mortgage Type
Purchase Money Mortgage
Purchase Details
Closed on
Aug 11, 2004
Sold by
Sli Commercial Real Estate Co
Bought by
Aspen Homes Development Inc
Home Financials for this Owner
Home Financials are based on the most recent Mortgage that was taken out on this home.
Original Mortgage
$165,600
Interest Rate
5.97%
Mortgage Type
Purchase Money Mortgage
Create a Home Valuation Report for This Property
The Home Valuation Report is an in-depth analysis detailing your home's value as well as a comparison with similar homes in the area
Home Values in the Area
Average Home Value in this Area
Purchase History
| Date | Buyer | Sale Price | Title Company |
|---|---|---|---|
| Keeler Christopher | -- | Stewart Title Ins Age | |
| Keeler Christopher | -- | Liberty Title | |
| Hurst Brooke L | -- | Us Title Co O | |
| Hurst Joshua S | -- | Bonneville Superior Title Co | |
| Altom Brian | -- | Mountain View Title & Escrow | |
| Aspen Homes Development Inc | -- | Bonneville Title Company Inc |
Source: Public Records
Mortgage History
| Date | Status | Borrower | Loan Amount |
|---|---|---|---|
| Open | Keeler Christopher | $272,600 | |
| Closed | Keeler Christopher | $260,000 | |
| Closed | Hurst Joshua S | $246,905 | |
| Previous Owner | Altom Brian | $165,600 |
Source: Public Records
Tax History Compared to Growth
Tax History
| Year | Tax Paid | Tax Assessment Tax Assessment Total Assessment is a certain percentage of the fair market value that is determined by local assessors to be the total taxable value of land and additions on the property. | Land | Improvement |
|---|---|---|---|---|
| 2025 | $2,803 | $269,500 | $109,474 | $160,026 |
| 2024 | $2,817 | $272,250 | $118,191 | $154,059 |
| 2023 | $2,673 | $478,000 | $138,247 | $339,753 |
| 2022 | $2,858 | $282,700 | $80,011 | $202,689 |
| 2021 | $2,541 | $373,000 | $107,943 | $265,057 |
| 2020 | $2,224 | $323,000 | $96,097 | $226,903 |
| 2019 | $2,142 | $304,000 | $104,293 | $199,707 |
| 2018 | $2,023 | $282,000 | $87,090 | $194,910 |
| 2016 | $1,822 | $131,175 | $34,786 | $96,389 |
| 2015 | $1,804 | $123,475 | $34,786 | $88,689 |
| 2014 | $1,751 | $121,718 | $34,786 | $86,932 |
| 2013 | -- | $116,602 | $30,667 | $85,935 |
Source: Public Records
Map
Nearby Homes
- 2322 N 2500 W
- 2592 W 2650 N
- 2219 N 2475 W
- 2617 N 2080 W Unit 176
- 2571 N 3200 W
- 3028 W 2600 N
- 2616 N 3020 W
- 3016 W 2650 N
- 2434 W 2250 N
- Harvard Plan at Summerfield - Enclave
- 2208 W 2615 N
- Linden Plan at Summerfield - Vista
- Yale Plan at Summerfield - Enclave
- Gambel Oak Plan at Summerfield - Vista
- Cedar Plan at Summerfield - Vista
- Elm Plan at Summerfield - Vista
- Princeton Plan at Summerfield - Enclave
- Cambridge Plan at Summerfield - Enclave
- Cornell Plan at Summerfield - Enclave
- Sycamore Plan at Summerfield - Vista