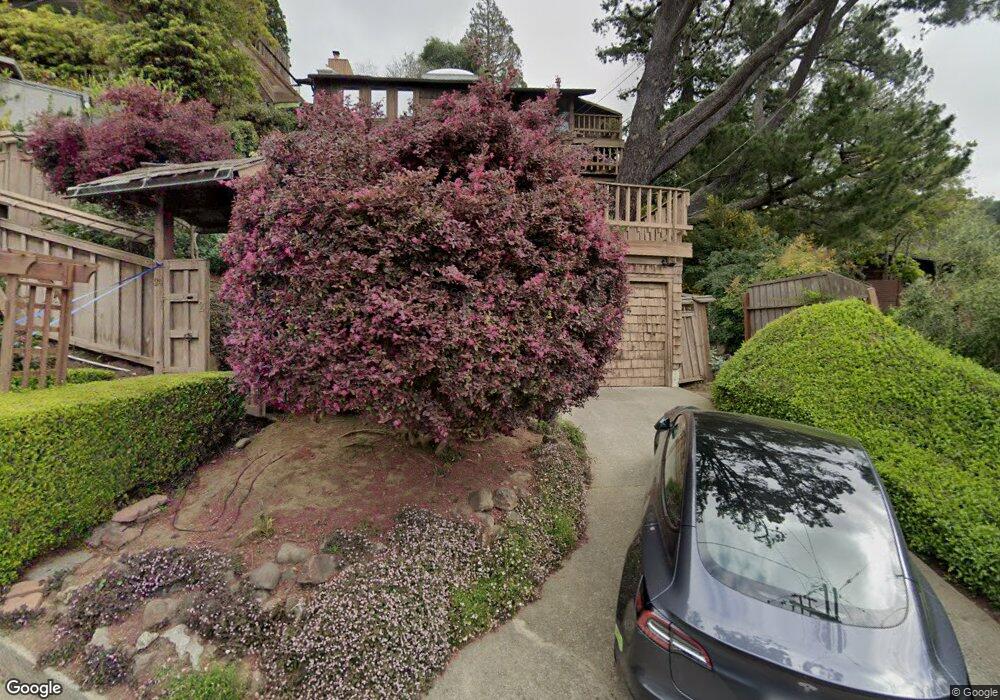
24 Arden Rd Berkeley, CA 94704
Estimated Value: $1,313,000 - $2,047,000
3
Beds
3
Baths
2,301
Sq Ft
$771/Sq Ft
Est. Value
About This Home
This home is located at 24 Arden Rd, Berkeley, CA 94704 and is currently estimated at $1,773,503, approximately $770 per square foot. 24 Arden Rd is a home located in Alameda County with nearby schools including Emerson Elementary School, John Muir Elementary School, and Malcolm X Elementary School.
Ownership History
Date
Name
Owned For
Owner Type
Purchase Details
Closed on
Mar 23, 2015
Sold by
Guest Nigel
Bought by
Guest Nigel Roderick Anthony and Guest Nigel Roderick
Current Estimated Value
Home Financials for this Owner
Home Financials are based on the most recent Mortgage that was taken out on this home.
Original Mortgage
$938,250
Outstanding Balance
$719,400
Interest Rate
3.71%
Mortgage Type
Reverse Mortgage Home Equity Conversion Mortgage
Estimated Equity
$1,054,103
Purchase Details
Closed on
May 2, 2011
Sold by
Guest Nigel
Bought by
Nigel Roderick Anthony Guest Revocable L
Purchase Details
Closed on
Feb 23, 1994
Sold by
Hibser Gregory C and David G Rohlf M D Revocable Tr
Bought by
Guest Nigel
Home Financials for this Owner
Home Financials are based on the most recent Mortgage that was taken out on this home.
Original Mortgage
$359,100
Interest Rate
5%
Create a Home Valuation Report for This Property
The Home Valuation Report is an in-depth analysis detailing your home's value as well as a comparison with similar homes in the area
Purchase History
| Date | Buyer | Sale Price | Title Company |
|---|---|---|---|
| Guest Nigel Roderick Anthony | -- | Placer Title Company | |
| Nigel Roderick Anthony Guest Revocable L | -- | None Available | |
| Guest Nigel | -- | Old Republic Title Company |
Source: Public Records
Mortgage History
| Date | Status | Borrower | Loan Amount |
|---|---|---|---|
| Open | Guest Nigel Roderick Anthony | $938,250 | |
| Closed | Guest Nigel | $359,100 |
Source: Public Records
Tax History
| Year | Tax Paid | Tax Assessment Tax Assessment Total Assessment is a certain percentage of the fair market value that is determined by local assessors to be the total taxable value of land and additions on the property. | Land | Improvement |
|---|---|---|---|---|
| 2025 | $12,162 | $671,140 | $203,442 | $474,698 |
| 2024 | $12,162 | $657,845 | $199,453 | $465,392 |
| 2023 | $11,836 | $651,810 | $195,543 | $456,267 |
| 2022 | $11,532 | $632,030 | $191,709 | $447,321 |
| 2021 | $11,537 | $619,501 | $187,950 | $438,551 |
| 2020 | $10,879 | $620,077 | $186,023 | $434,054 |
| 2019 | $10,398 | $607,920 | $182,376 | $425,544 |
| 2018 | $10,193 | $596,001 | $178,800 | $417,201 |
| 2017 | $9,828 | $584,318 | $175,295 | $409,023 |
| 2016 | $9,462 | $572,863 | $171,859 | $401,004 |
| 2015 | $9,320 | $564,261 | $169,278 | $394,983 |
| 2014 | $11,000 | $553,208 | $165,962 | $387,246 |
Source: Public Records
Map
Nearby Homes
- 161 Panoramic Way
- 39 Canyon Rd
- 2 Panoramic Way Unit 105
- 2 Panoramic Way Unit 304
- 0 Panoramic Way Unit 41118724
- 3382 Dwight Way
- 2611 Piedmont Ave Unit 4
- 2632 Warring St Unit 3
- 2601 College Ave Unit 203
- 2601 College Ave Unit 208
- 190 Stonewall Rd
- 2817 Palm Ct
- 2509 Dwight Way
- 7723 Claremont Ave
- 2643 Stuart St
- 2 Gravatt Dr
- 2700 Le Conte Ave Unit 301
- 2700 Le Conte Ave Unit 402
- 0 Gravatt Dr Unit 41122154
- 2535 Chilton Way
- 40 Arden Rd
- 10 Arden Rd
- 157 Panoramic Way
- 50 Arden Rd
- 125 Panoramic Way
- 9 Arden Rd
- 222 Panoramic Way
- 121 Panoramic Way
- 265 Panoramic Way
- 208 Panoramic Way
- 62 Arden Rd Unit 2
- 60 Arden Rd
- 136 Panoramic Way
- 260 Panoramic Way
- 130 Panoramic Way
- 140 Panoramic Way
- 59 Arden Rd
- 122 Panoramic Way
- 64 Arden Rd
- 70 Arden Rd
Your Personal Tour Guide
Ask me questions while you tour the home.