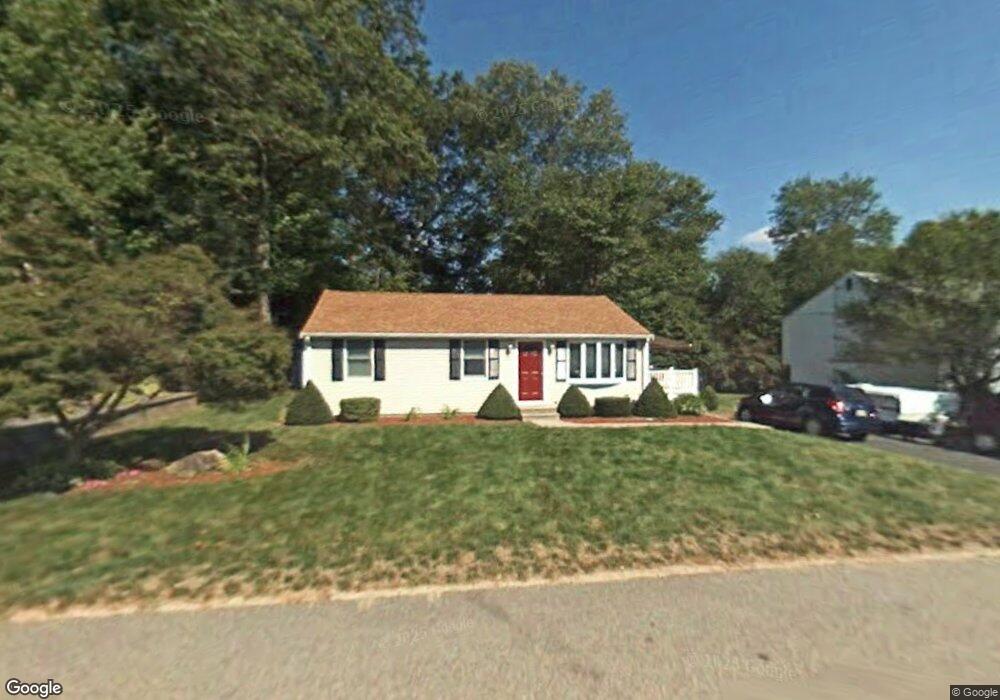
24 Calvin St Brockton, MA 02301
Estimated Value: $403,904 - $459,000
3
Beds
1
Bath
864
Sq Ft
$499/Sq Ft
Est. Value
About This Home
This home is located at 24 Calvin St, Brockton, MA 02301 and is currently estimated at $430,976, approximately $498 per square foot. 24 Calvin St is a home located in Plymouth County with nearby schools including Hancock Elementary School, Manthala George Jr. School, and Louis F Angelo Elementary School.
Ownership History
Date
Name
Owned For
Owner Type
Purchase Details
Closed on
Nov 26, 1996
Sold by
Villa James A and Villa Susan A
Bought by
Lacey Shawn D and Falvey Kristen M
Current Estimated Value
Home Financials for this Owner
Home Financials are based on the most recent Mortgage that was taken out on this home.
Original Mortgage
$82,157
Outstanding Balance
$8,434
Interest Rate
7.81%
Mortgage Type
Purchase Money Mortgage
Estimated Equity
$422,542
Create a Home Valuation Report for This Property
The Home Valuation Report is an in-depth analysis detailing your home's value as well as a comparison with similar homes in the area
Purchase History
| Date | Buyer | Sale Price | Title Company |
|---|---|---|---|
| Lacey Shawn D | $83,000 | -- |
Source: Public Records
Mortgage History
| Date | Status | Borrower | Loan Amount |
|---|---|---|---|
| Open | Lacey Shawn D | $40,000 | |
| Open | Lacey Shawn D | $82,157 | |
| Previous Owner | Lacey Shawn D | $57,500 |
Source: Public Records
Tax History
| Year | Tax Paid | Tax Assessment Tax Assessment Total Assessment is a certain percentage of the fair market value that is determined by local assessors to be the total taxable value of land and additions on the property. | Land | Improvement |
|---|---|---|---|---|
| 2025 | $4,448 | $367,300 | $144,500 | $222,800 |
| 2024 | $4,331 | $360,300 | $144,500 | $215,800 |
| 2023 | $4,341 | $334,400 | $109,400 | $225,000 |
| 2022 | $4,047 | $289,700 | $99,400 | $190,300 |
| 2021 | $3,793 | $261,600 | $93,200 | $168,400 |
| 2020 | $3,769 | $248,800 | $89,400 | $159,400 |
| 2019 | $3,933 | $248,200 | $83,400 | $164,800 |
| 2018 | $3,357 | $209,000 | $83,400 | $125,600 |
| 2017 | $2,938 | $182,500 | $83,400 | $99,100 |
| 2016 | $2,996 | $172,600 | $79,500 | $93,100 |
| 2015 | $2,850 | $157,000 | $79,500 | $77,500 |
| 2014 | $2,654 | $146,400 | $79,500 | $66,900 |
Source: Public Records
Map
Nearby Homes
- 18 Edinboro Ave
- 130 Braemoor Rd
- 18 Sagamore Rd
- 31 Magnolia Ave
- 32 Hampden Ave
- 74 Linwood St
- 155 Rockland Dr
- 197 Candy Ln
- 18 Belmont Place
- 81 Hancock Ave
- 28 Frost Ave
- 47 N Belcher Ave
- 12 Frost Ave
- 596 Ash St
- 990 Pleasant St
- 433 W Elm St Unit 2
- 425 W Elm St Unit 7
- 11 Auna Dr Unit 6
- 29 Auna Dr Unit 3
- 193 Boylston St
Your Personal Tour Guide
Ask me questions while you tour the home.