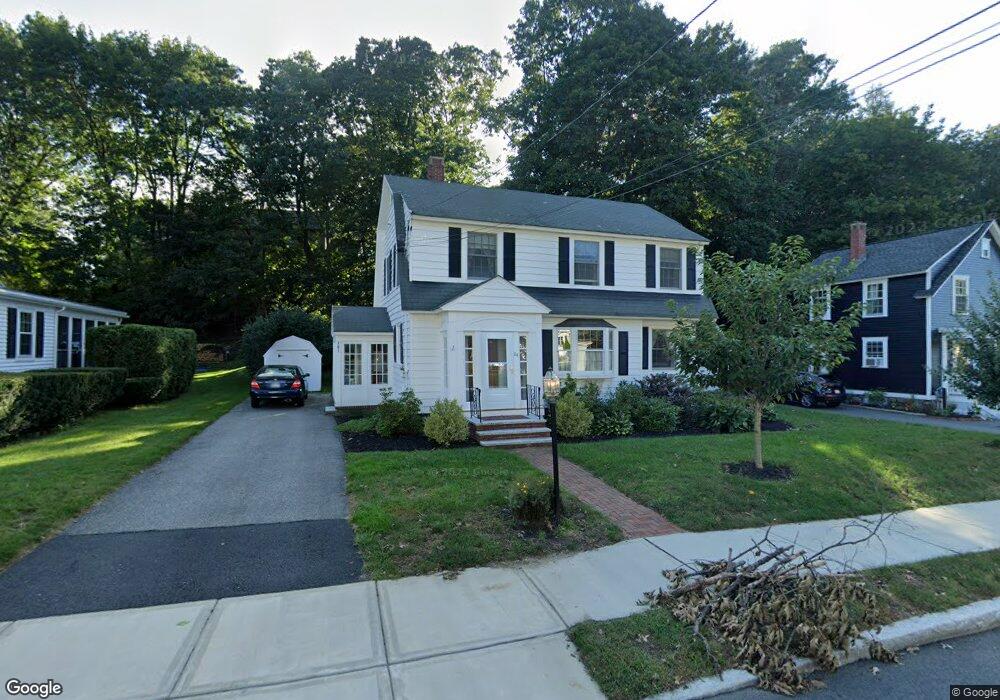
24 Enmore St Andover, MA 01810
Shawsheen Heights NeighborhoodEstimated Value: $690,000 - $785,000
3
Beds
2
Baths
1,528
Sq Ft
$492/Sq Ft
Est. Value
About This Home
This home is located at 24 Enmore St, Andover, MA 01810 and is currently estimated at $751,369, approximately $491 per square foot. 24 Enmore St is a home located in Essex County with nearby schools including West Elementary School, Andover West Middle School, and Andover High School.
Ownership History
Date
Name
Owned For
Owner Type
Purchase Details
Closed on
Aug 1, 2014
Sold by
Cddd Nt and Knight
Bought by
Knight Cheryl A and Bourgeois Diane M
Current Estimated Value
Purchase Details
Closed on
Oct 14, 2008
Sold by
Bourgeois Normand W and Bourgeois Barbara A
Bought by
Knight Tr Cheryl A and Bourgeois Diane M
Create a Home Valuation Report for This Property
The Home Valuation Report is an in-depth analysis detailing your home's value as well as a comparison with similar homes in the area
Home Values in the Area
Average Home Value in this Area
Purchase History
| Date | Buyer | Sale Price | Title Company |
|---|---|---|---|
| Knight Cheryl A | -- | -- | |
| Knight Cheryl A | -- | -- | |
| Knight Tr Cheryl A | -- | -- | |
| Knight Tr Cheryl A | -- | -- |
Source: Public Records
Mortgage History
| Date | Status | Borrower | Loan Amount |
|---|---|---|---|
| Previous Owner | Knight Tr Cheryl A | $35,000 | |
| Previous Owner | Knight Tr Cheryl A | $25,000 |
Source: Public Records
Tax History Compared to Growth
Tax History
| Year | Tax Paid | Tax Assessment Tax Assessment Total Assessment is a certain percentage of the fair market value that is determined by local assessors to be the total taxable value of land and additions on the property. | Land | Improvement |
|---|---|---|---|---|
| 2024 | $9,404 | $730,100 | $465,500 | $264,600 |
| 2023 | $8,977 | $657,200 | $419,300 | $237,900 |
| 2022 | $8,503 | $582,400 | $371,100 | $211,300 |
| 2021 | $8,379 | $548,000 | $337,400 | $210,600 |
| 2020 | $8,032 | $535,100 | $329,100 | $206,000 |
| 2019 | $7,527 | $492,900 | $291,500 | $201,400 |
| 2018 | $7,188 | $459,600 | $275,000 | $184,600 |
| 2017 | $6,870 | $452,600 | $269,700 | $182,900 |
| 2016 | $6,448 | $435,100 | $252,200 | $182,900 |
| 2015 | $6,208 | $414,700 | $242,600 | $172,100 |
Source: Public Records
Map
Nearby Homes
- 156 High St
- 1 Longwood Dr Unit 105
- 20 Walnut Ave
- 170 Haverhill St Unit 138
- 6 Windsor St
- 2 Powder Mill Square Unit 2B
- 105 Elm St Unit A
- 42 Stevens St
- 88 Kingston St
- 32 Lucerne Dr
- 2 Kingston St Unit 2
- 156 Kingston St Unit 156
- Lot 7 Weeping Willow Dr
- 70 Farrwood Ave Unit 7
- 102 Weare St
- 75 Edgelawn Ave Unit 1
- 180 Chickering Rd Unit 310C
- 21 Clubview Dr Unit 21
- 124 Quail Run Rd
- 136 Quail Run Rd