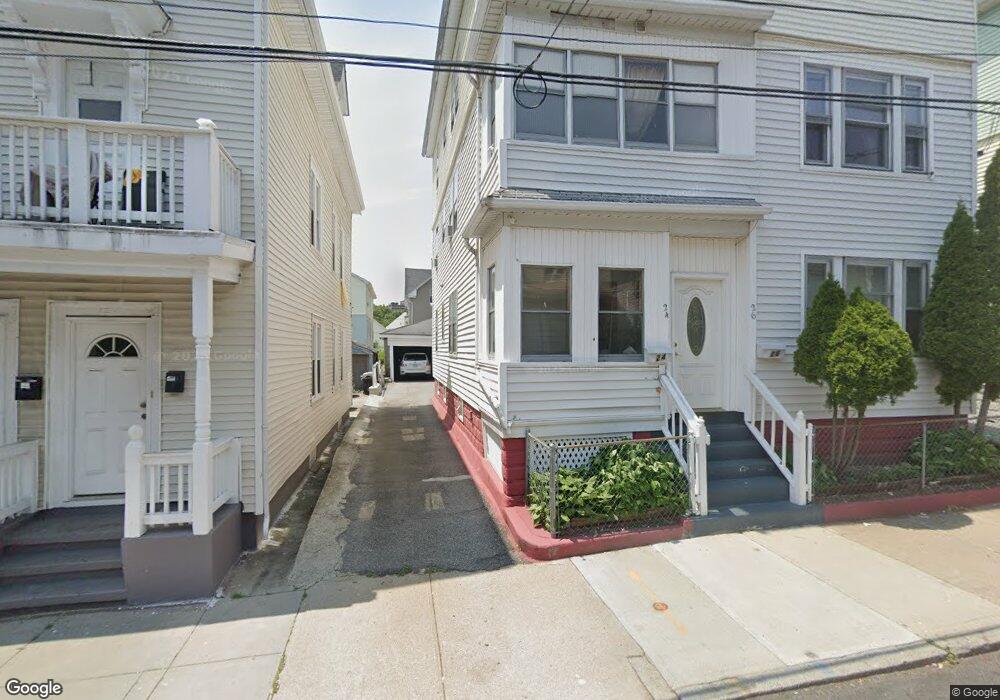
24 Felix St Providence, RI 02908
Smith Hill NeighborhoodEstimated Value: $606,000 - $716,000
6
Beds
3
Baths
3,216
Sq Ft
$204/Sq Ft
Est. Value
About This Home
This home is located at 24 Felix St, Providence, RI 02908 and is currently estimated at $655,000, approximately $203 per square foot. 24 Felix St is a home located in Providence County with nearby schools including Asa Messer Elementary School, Charles N. Fortes Elementary School, and Veazie Street Elementary School.
Ownership History
Date
Name
Owned For
Owner Type
Purchase Details
Closed on
Dec 11, 2014
Sold by
Xayyapanya Joe and Xayyapanya Migna Douangmaly
Bought by
Xayyapanya Joe
Current Estimated Value
Home Financials for this Owner
Home Financials are based on the most recent Mortgage that was taken out on this home.
Original Mortgage
$40,000
Interest Rate
3.98%
Mortgage Type
New Conventional
Purchase Details
Closed on
Oct 4, 2001
Sold by
Arounlangsy Samphone
Bought by
Xayyapanya Joe
Home Financials for this Owner
Home Financials are based on the most recent Mortgage that was taken out on this home.
Original Mortgage
$60,000
Interest Rate
6.89%
Mortgage Type
Purchase Money Mortgage
Create a Home Valuation Report for This Property
The Home Valuation Report is an in-depth analysis detailing your home's value as well as a comparison with similar homes in the area
Home Values in the Area
Average Home Value in this Area
Purchase History
| Date | Buyer | Sale Price | Title Company |
|---|---|---|---|
| Xayyapanya Joe | -- | -- | |
| Xayyapanya Joe | $80,000 | -- |
Source: Public Records
Mortgage History
| Date | Status | Borrower | Loan Amount |
|---|---|---|---|
| Closed | Xayyapanya Joe | $40,000 | |
| Previous Owner | Xayyapanya Joe | $60,000 |
Source: Public Records
Tax History Compared to Growth
Tax History
| Year | Tax Paid | Tax Assessment Tax Assessment Total Assessment is a certain percentage of the fair market value that is determined by local assessors to be the total taxable value of land and additions on the property. | Land | Improvement |
|---|---|---|---|---|
| 2025 | $4,362 | $577,800 | $144,000 | $433,800 |
| 2024 | $6,514 | $355,000 | $68,000 | $287,000 |
| 2023 | $6,514 | $355,000 | $68,000 | $287,000 |
| 2022 | $6,319 | $355,000 | $68,000 | $287,000 |
| 2021 | $5,175 | $210,700 | $33,600 | $177,100 |
| 2020 | $5,175 | $210,700 | $33,600 | $177,100 |
| 2019 | $5,175 | $210,700 | $33,600 | $177,100 |
| 2018 | $4,644 | $145,300 | $36,000 | $109,300 |
| 2017 | $4,644 | $145,300 | $36,000 | $109,300 |
| 2016 | $4,644 | $145,300 | $36,000 | $109,300 |
| 2015 | $4,416 | $133,400 | $47,100 | $86,300 |
| 2014 | $4,502 | $133,400 | $47,100 | $86,300 |
| 2013 | $4,502 | $133,400 | $47,100 | $86,300 |
Source: Public Records
Map
Nearby Homes
- 39 Richter St
- 23 Richter St
- 160 Jewett St
- 316 Orms St
- 510 Chalkstone Ave
- 508 Chalkstone Ave
- 94 Garfield Ave
- 308 Pleasant Valley Pkwy
- 17 Alma St
- 18 Winsor St
- 15 Crimea St
- 154 Camden Ave
- 18 Whipple St
- 1000 Providence Place Unit 234
- 1000 Providence Place Unit 120
- 1000 Providence Place Unit 451
- 1000 Providence Place Unit 325
- 1000 Providence Place Unit 101
- 1000 Providence Place Unit 221
- 1000 Providence Place Unit 339