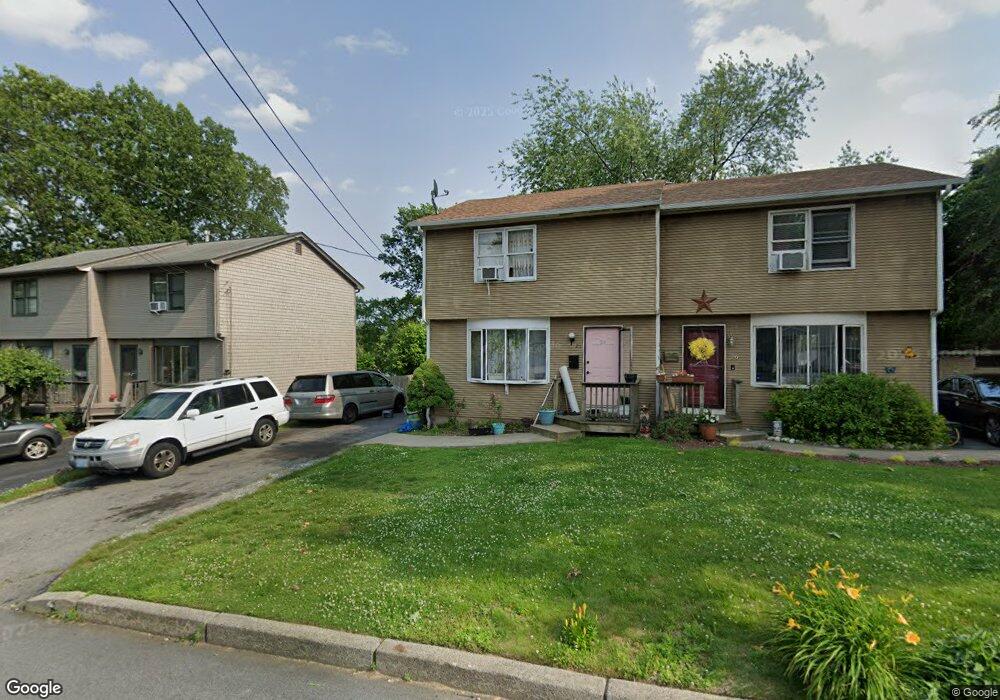
24 Gordon St Unit 26 Cranston, RI 02910
Cranston Stadium/Spectacle NeighborhoodEstimated Value: $513,221 - $560,000
4
Beds
4
Baths
2,040
Sq Ft
$259/Sq Ft
Est. Value
About This Home
This home is located at 24 Gordon St Unit 26, Cranston, RI 02910 and is currently estimated at $529,305, approximately $259 per square foot. 24 Gordon St Unit 26 is a home located in Providence County with nearby schools including Stadium Elementary School, Hugh B. Bain Middle School, and Cranston High School East.
Ownership History
Date
Name
Owned For
Owner Type
Purchase Details
Closed on
Nov 5, 2004
Sold by
Frajeschi Marc
Bought by
Cheong-Leung Tony Sai and Choi Pui Yee
Current Estimated Value
Home Financials for this Owner
Home Financials are based on the most recent Mortgage that was taken out on this home.
Original Mortgage
$247,920
Outstanding Balance
$125,682
Interest Rate
5.71%
Mortgage Type
Purchase Money Mortgage
Estimated Equity
$403,623
Purchase Details
Closed on
Apr 28, 2000
Sold by
Mariano Robert
Bought by
Frateschi Marc A
Home Financials for this Owner
Home Financials are based on the most recent Mortgage that was taken out on this home.
Original Mortgage
$140,600
Interest Rate
8.23%
Purchase Details
Closed on
Jul 29, 1991
Sold by
Crb Inc
Bought by
Marinaro Robert
Home Financials for this Owner
Home Financials are based on the most recent Mortgage that was taken out on this home.
Original Mortgage
$132,300
Interest Rate
9.58%
Create a Home Valuation Report for This Property
The Home Valuation Report is an in-depth analysis detailing your home's value as well as a comparison with similar homes in the area
Home Values in the Area
Average Home Value in this Area
Purchase History
| Date | Buyer | Sale Price | Title Company |
|---|---|---|---|
| Cheong-Leung Tony Sai | $310,000 | -- | |
| Frateschi Marc A | $148,000 | -- | |
| Marinaro Robert | $147,000 | -- |
Source: Public Records
Mortgage History
| Date | Status | Borrower | Loan Amount |
|---|---|---|---|
| Open | Marinaro Robert | $247,920 | |
| Previous Owner | Marinaro Robert | $159,800 | |
| Previous Owner | Marinaro Robert | $140,600 | |
| Previous Owner | Marinaro Robert | $132,300 |
Source: Public Records
Tax History Compared to Growth
Tax History
| Year | Tax Paid | Tax Assessment Tax Assessment Total Assessment is a certain percentage of the fair market value that is determined by local assessors to be the total taxable value of land and additions on the property. | Land | Improvement |
|---|---|---|---|---|
| 2024 | $5,149 | $378,300 | $102,500 | $275,800 |
| 2023 | $5,292 | $280,000 | $70,700 | $209,300 |
| 2022 | $5,183 | $280,000 | $70,700 | $209,300 |
| 2021 | $5,040 | $280,000 | $70,700 | $209,300 |
| 2020 | $4,692 | $225,900 | $67,200 | $158,700 |
| 2019 | $4,692 | $225,900 | $67,200 | $158,700 |
| 2018 | $4,584 | $225,900 | $67,200 | $158,700 |
| 2017 | $4,200 | $183,100 | $49,500 | $133,600 |
| 2016 | $4,111 | $183,100 | $49,500 | $133,600 |
| 2015 | $4,111 | $183,100 | $49,500 | $133,600 |
| 2014 | $4,445 | $194,600 | $49,500 | $145,100 |
Source: Public Records
Map
Nearby Homes