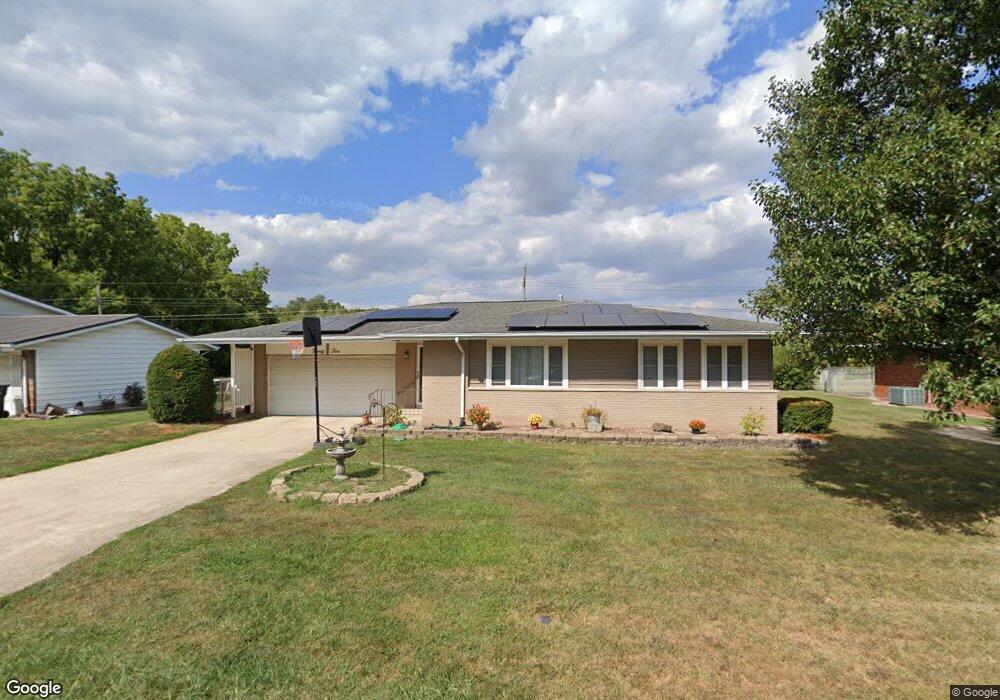
24 N Lakewood Dr Effingham, IL 62401
Estimated Value: $183,000 - $330,000
3
Beds
2
Baths
1,515
Sq Ft
$155/Sq Ft
Est. Value
About This Home
This home is located at 24 N Lakewood Dr, Effingham, IL 62401 and is currently estimated at $234,188, approximately $154 per square foot. 24 N Lakewood Dr is a home located in Effingham County with nearby schools including South Side Grade School, Early Learning Center, and Central Grade School.
Ownership History
Date
Name
Owned For
Owner Type
Purchase Details
Closed on
Oct 30, 2020
Sold by
Jansen Ruth T and Ruth T Jansen Trust
Bought by
Goldstein Thomas A and Goldstein Jaqueline D
Current Estimated Value
Home Financials for this Owner
Home Financials are based on the most recent Mortgage that was taken out on this home.
Original Mortgage
$132,000
Outstanding Balance
$117,672
Interest Rate
2.9%
Mortgage Type
New Conventional
Estimated Equity
$116,516
Purchase Details
Closed on
May 25, 2006
Sold by
Frese Anthony J and Frese Kimberly M
Bought by
Jansen Ruth T and Ruth T Jansen Trust
Home Financials for this Owner
Home Financials are based on the most recent Mortgage that was taken out on this home.
Original Mortgage
$45,000
Interest Rate
6.66%
Mortgage Type
New Conventional
Create a Home Valuation Report for This Property
The Home Valuation Report is an in-depth analysis detailing your home's value as well as a comparison with similar homes in the area
Home Values in the Area
Average Home Value in this Area
Purchase History
| Date | Buyer | Sale Price | Title Company |
|---|---|---|---|
| Goldstein Thomas A | $130,000 | Attorney | |
| Jansen Ruth T | $95,000 | None Available |
Source: Public Records
Mortgage History
| Date | Status | Borrower | Loan Amount |
|---|---|---|---|
| Open | Goldstein Thomas A | $132,000 | |
| Previous Owner | Jansen Ruth T | $45,000 |
Source: Public Records
Tax History Compared to Growth
Tax History
| Year | Tax Paid | Tax Assessment Tax Assessment Total Assessment is a certain percentage of the fair market value that is determined by local assessors to be the total taxable value of land and additions on the property. | Land | Improvement |
|---|---|---|---|---|
| 2024 | $3,581 | $59,000 | $13,720 | $45,280 |
| 2023 | $3,243 | $53,630 | $12,470 | $41,160 |
| 2022 | $3,016 | $49,200 | $11,440 | $37,760 |
| 2021 | $3,099 | $48,720 | $11,330 | $37,390 |
| 2020 | $1,893 | $47,350 | $11,010 | $36,340 |
| 2019 | $1,876 | $46,880 | $10,900 | $35,980 |
| 2018 | $1,888 | $45,080 | $10,480 | $34,600 |
| 2017 | $1,892 | $44,190 | $10,270 | $33,920 |
| 2016 | $1,908 | $42,900 | $9,970 | $32,930 |
| 2015 | -- | $41,650 | $9,680 | $31,970 |
| 2014 | -- | $40,440 | $9,400 | $31,040 |
| 2013 | -- | $39,650 | $9,220 | $30,430 |
| 2012 | -- | $39,060 | $9,080 | $29,980 |
Source: Public Records
Map
Nearby Homes
- 0 S Lakewood Dr
- 0 Augusta National Dr Unit 6255461
- 1600 W Fayette Ave
- 1006 N Koester Dr
- 702 W Fayette Ave
- 710 W Richland Ave
- 406 W Kentucky Ave
- 601 S Maple St
- 407 W Edgar Ave
- 1201 N Martin St
- 505 W Evergreen Ave
- 100 E Temple Ave
- 1105 N Merchant St
- 602 S 5th St
- 812 S 4th St
- 104 S Willow St
- 801 N Cleveland St
- 603 E Saint Louis Ave
- 1005 S 3rd St
- 805 N Glenwood St
- 24 N Lakewood Dr Unit 15970 N Lakeview Dr
- 22 N Lakewood Dr
- 28 N Lakewood Dr
- 20 N Lakewood Dr
- 30 N Lakewood Dr
- 9 N Lakewood Dr
- 7 N Lakewood Dr
- 5 N Lakewood Dr
- 11 N Lakewood Dr
- 32 N Lakewood Dr
- 18 N Lakewood Dr
- 13 N Lakewood Dr
- 3 N Lakewood Dr
- 20 Rollin Hills Blvd
- 18 Rollin Hills Blvd
- 15 N Lakewood Dr
- 22 Rollin Hills Blvd
- 16 N Lakewood Dr
- 1 N Lakewood Dr
- 16 Rollin Hills Blvd