Estimated Value: $786,000 - $1,500,000
3
Beds
1
Bath
1,120
Sq Ft
$945/Sq Ft
Est. Value
About This Home
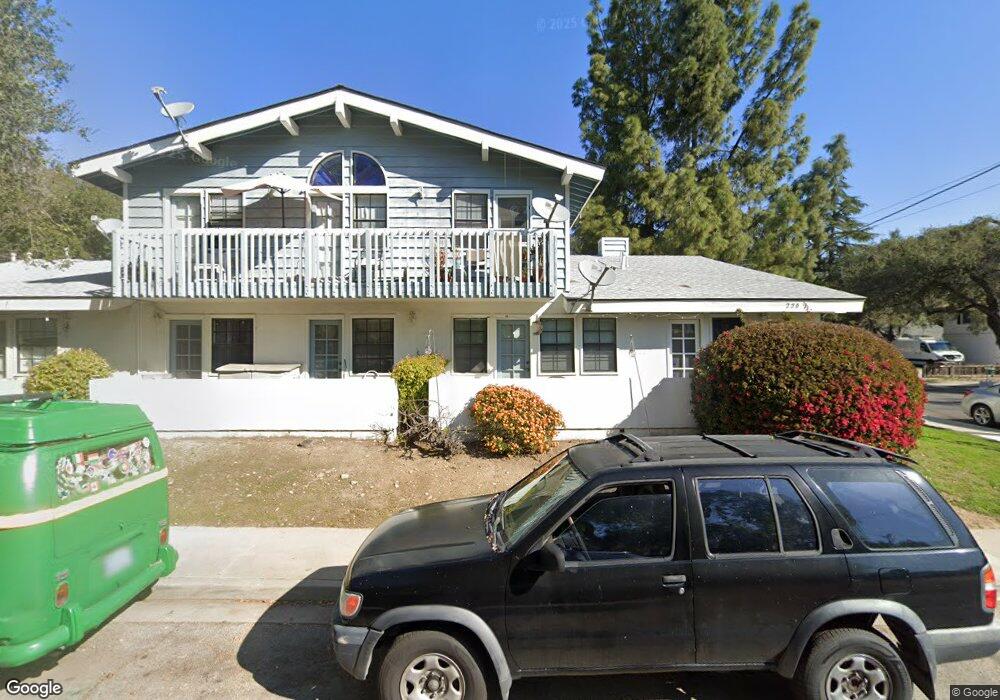
This home is located at 240 E Oak St, Ojai, CA 93023 and is currently estimated at $1,058,292, approximately $944 per square foot. 240 E Oak St is a home located in Ventura County with nearby schools including Topa Topa Elementary School, Meiners Oaks Elementary School, and Matilija Junior High.
Ownership History
Date
Name
Owned For
Owner Type
Purchase Details
Closed on
Dec 17, 2020
Sold by
Hubbell Stanley and Hubbell A W
Bought by
Bones Shawn and Bones Brittany Marie
Current Estimated Value
Home Financials for this Owner
Home Financials are based on the most recent Mortgage that was taken out on this home.
Original Mortgage
$455,000
Outstanding Balance
$404,868
Interest Rate
2.67%
Mortgage Type
New Conventional
Estimated Equity
$653,424
Purchase Details
Closed on
Nov 12, 2013
Sold by
Moore Richard Jack
Bought by
Hubbell Stanley and Hubbell W
Create a Home Valuation Report for This Property
The Home Valuation Report is an in-depth analysis detailing your home's value as well as a comparison with similar homes in the area
Home Values in the Area
Average Home Value in this Area
Purchase History
| Date | Buyer | Sale Price | Title Company |
|---|---|---|---|
| Bones Shawn | $620,000 | Lawyers Title Company | |
| Hubbell Stanley | $356,500 | Fidelity National Title Co |
Source: Public Records
Mortgage History
| Date | Status | Borrower | Loan Amount |
|---|---|---|---|
| Open | Bones Shawn | $455,000 |
Source: Public Records
Tax History
| Year | Tax Paid | Tax Assessment Tax Assessment Total Assessment is a certain percentage of the fair market value that is determined by local assessors to be the total taxable value of land and additions on the property. | Land | Improvement |
|---|---|---|---|---|
| 2025 | $8,002 | $671,106 | $436,220 | $234,886 |
| 2024 | $8,002 | $657,948 | $427,667 | $230,281 |
| 2023 | $7,880 | $645,048 | $419,282 | $225,766 |
| 2022 | $7,403 | $632,400 | $411,060 | $221,340 |
| 2021 | $5,089 | $403,730 | $315,965 | $87,765 |
| 2020 | $5,031 | $399,592 | $312,726 | $86,866 |
| 2019 | $4,936 | $391,758 | $306,595 | $85,163 |
| 2018 | $4,849 | $384,078 | $300,584 | $83,494 |
| 2017 | $4,762 | $376,548 | $294,691 | $81,857 |
| 2016 | $4,685 | $369,165 | $288,913 | $80,252 |
| 2015 | $4,629 | $363,622 | $284,574 | $79,048 |
| 2014 | $4,552 | $356,500 | $279,000 | $77,500 |
Source: Public Records
Map
Nearby Homes
- 207 E Eucalyptus St
- 216 E Aliso St
- 0 N Ventura Unit TR25015633
- 408 Canada St
- 203 S Montgomery St
- 201 Drown Ave
- 608 E Ojai Ave
- 211 Fox St
- 207 S Blanche St
- 310 N Fulton St
- 810 Libby Ave
- 212 Foothill Rd
- 312 Fox St
- 203 Foothill Rd
- 515 Del Oro Dr
- 520 Foothill Rd
- 917 Grandview Ave
- 913 Mountain View Ave
- 1201 Grand Ave
- 0 E Ojai Ave Unit 224929
Your Personal Tour Guide
Ask me questions while you tour the home.