Estimated Value: $970,779 - $1,162,000
4
Beds
2
Baths
1,957
Sq Ft
$535/Sq Ft
Est. Value
About This Home
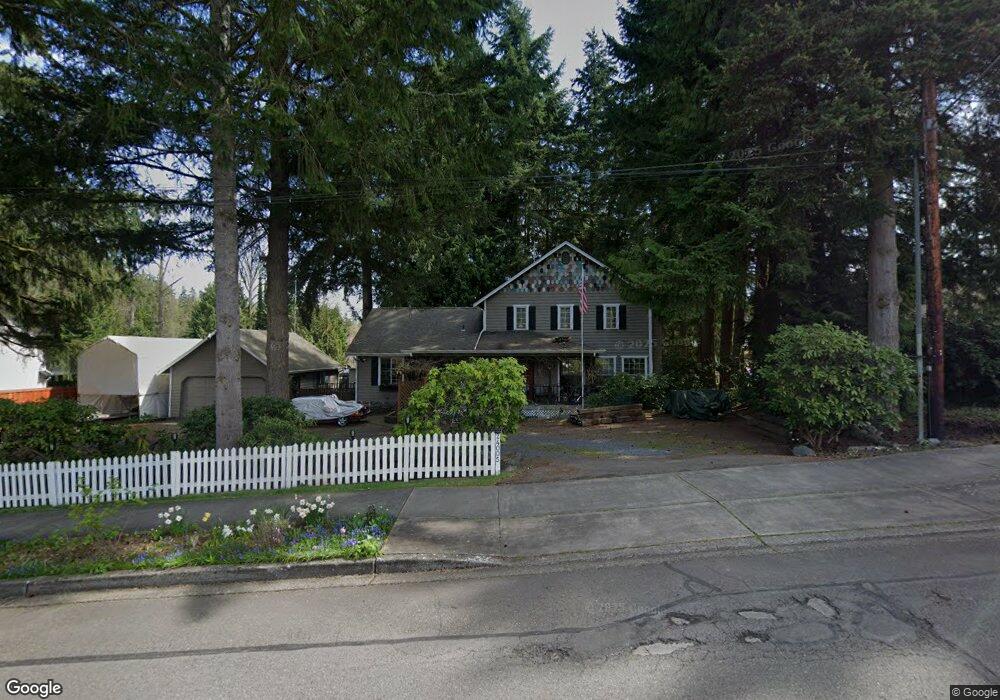
This home is located at 24005 35th Ave W, Brier, WA 98036 and is currently estimated at $1,046,945, approximately $534 per square foot. 24005 35th Ave W is a home located in Snohomish County with nearby schools including Brier Elementary School, Brier Terrace Middle School, and Mountlake Terrace High School.
Ownership History
Date
Name
Owned For
Owner Type
Purchase Details
Closed on
Jun 19, 2009
Sold by
Keith Craig and Keith Lesa A
Bought by
Archer James R and Pagh Kimberly A
Current Estimated Value
Home Financials for this Owner
Home Financials are based on the most recent Mortgage that was taken out on this home.
Original Mortgage
$332,100
Outstanding Balance
$210,391
Interest Rate
4.82%
Mortgage Type
Purchase Money Mortgage
Estimated Equity
$836,554
Purchase Details
Closed on
Apr 23, 2003
Sold by
Wahl Ricky L and Wahl Kathryn D
Bought by
Keith Craig L and Keith Lesa A
Home Financials for this Owner
Home Financials are based on the most recent Mortgage that was taken out on this home.
Original Mortgage
$215,000
Interest Rate
4%
Mortgage Type
Purchase Money Mortgage
Purchase Details
Closed on
Dec 1, 1994
Sold by
Weaver Dean L
Bought by
Wahl Ricky L and Wahl Kathryn D
Home Financials for this Owner
Home Financials are based on the most recent Mortgage that was taken out on this home.
Original Mortgage
$161,900
Interest Rate
7.12%
Create a Home Valuation Report for This Property
The Home Valuation Report is an in-depth analysis detailing your home's value as well as a comparison with similar homes in the area
Home Values in the Area
Average Home Value in this Area
Purchase History
| Date | Buyer | Sale Price | Title Company |
|---|---|---|---|
| Archer James R | $369,280 | Pnwt | |
| Keith Craig L | $269,000 | Lawyers Title Agency | |
| Wahl Ricky L | $179,900 | Chicago Title Ins Co |
Source: Public Records
Mortgage History
| Date | Status | Borrower | Loan Amount |
|---|---|---|---|
| Open | Archer James R | $332,100 | |
| Previous Owner | Keith Craig L | $215,000 | |
| Previous Owner | Wahl Ricky L | $161,900 |
Source: Public Records
Tax History Compared to Growth
Tax History
| Year | Tax Paid | Tax Assessment Tax Assessment Total Assessment is a certain percentage of the fair market value that is determined by local assessors to be the total taxable value of land and additions on the property. | Land | Improvement |
|---|---|---|---|---|
| 2025 | $6,146 | $813,800 | $533,500 | $280,300 |
| 2024 | $6,146 | $778,300 | $507,300 | $271,000 |
| 2023 | $5,985 | $910,700 | $606,300 | $304,400 |
| 2022 | $5,217 | $644,500 | $384,100 | $260,400 |
| 2020 | $5,055 | $557,400 | $330,800 | $226,600 |
| 2019 | $4,442 | $491,000 | $266,800 | $224,200 |
| 2018 | $4,764 | $456,100 | $252,200 | $203,900 |
| 2017 | $3,977 | $399,200 | $208,600 | $190,600 |
| 2016 | $3,513 | $355,800 | $172,700 | $183,100 |
| 2015 | $3,557 | $337,300 | $164,900 | $172,400 |
| 2013 | $2,950 | $264,100 | $120,300 | $143,800 |
Source: Public Records
Map
Nearby Homes
- 23726 35th Ave W
- 24007 44th Ave W
- 5418 NE 200th Place
- 3113 232nd St SW
- 20317 58th Ln NE
- 23200 29th Ave W
- 23325 Cedar Way Unit G105
- 23319 Cedar Way Unit K105
- 23301 Cedar Way Unit U102
- 2723 232nd St SW
- 22824 35th Ave W
- 22912 39th Ave W
- 22841 32nd Ave W
- 3730 NE 194th St
- 4009 229th Place SW
- 24115 22nd Place W
- 23902 48th Ave W
- 5514 NE 195th St
- 6042 NE 200th St
- 19415 36th Ct NE
- 3503 Alaska Rd
- 24001 35th Ave W
- 3417 Alaska Rd
- 3415 Alaska Rd
- 3427 Alaska Rd
- 3413 Alaska Rd
- 23939 35th Ave W
- 24012 34th Place W
- 24006 34th Place W
- 3411 Alaska Rd
- 3430 238th St SW
- 23928 35th Ave W
- 24003 34th Place W
- 23901 35th Ave W
- 24090 34th Place W
- 24186 34th Ave W
- 3703 Alaska Rd
- 3407 Alaska Rd
- 23908 35th Ave W
- 24074 34th Place W