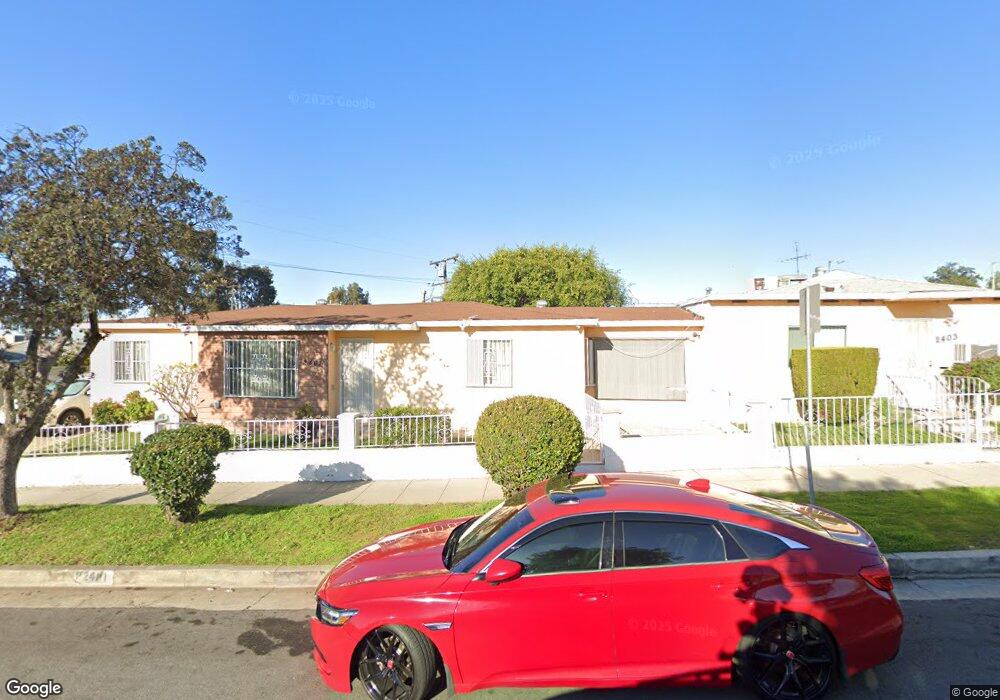
2401 W Via Lucia Montebello, CA 90640
Estimated Value: $836,739 - $952,000
3
Beds
2
Baths
1,691
Sq Ft
$515/Sq Ft
Est. Value
About This Home
This home is located at 2401 W Via Lucia, Montebello, CA 90640 and is currently estimated at $871,685, approximately $515 per square foot. 2401 W Via Lucia is a home located in Los Angeles County with nearby schools including Wilcox Elementary School, Eastmont Intermediate School, and Schurr High School.
Ownership History
Date
Name
Owned For
Owner Type
Purchase Details
Closed on
Aug 6, 2014
Sold by
Craig Lorena
Bought by
Craig Lorena and Lorena Craig Living Trust
Current Estimated Value
Purchase Details
Closed on
Sep 22, 2009
Sold by
Campos Maria E
Bought by
Craig Lorena
Home Financials for this Owner
Home Financials are based on the most recent Mortgage that was taken out on this home.
Original Mortgage
$280,000
Outstanding Balance
$181,343
Interest Rate
5%
Mortgage Type
New Conventional
Estimated Equity
$690,342
Purchase Details
Closed on
May 31, 2007
Sold by
Fung Susan Y and The Susan Y Fung Revocable Tru
Bought by
Campos Maria E
Home Financials for this Owner
Home Financials are based on the most recent Mortgage that was taken out on this home.
Original Mortgage
$440,000
Interest Rate
7.25%
Mortgage Type
New Conventional
Purchase Details
Closed on
Jun 6, 1996
Sold by
Fung Susan Y
Bought by
Fung Susan Y and The Susan Y Fung Revocable Tru
Create a Home Valuation Report for This Property
The Home Valuation Report is an in-depth analysis detailing your home's value as well as a comparison with similar homes in the area
Home Values in the Area
Average Home Value in this Area
Purchase History
| Date | Buyer | Sale Price | Title Company |
|---|---|---|---|
| Craig Lorena | -- | None Available | |
| Craig Lorena | $360,000 | Cctn | |
| Campos Maria E | $550,000 | Southland Title | |
| Fung Susan Y | -- | -- |
Source: Public Records
Mortgage History
| Date | Status | Borrower | Loan Amount |
|---|---|---|---|
| Open | Craig Lorena | $280,000 | |
| Previous Owner | Campos Maria E | $440,000 |
Source: Public Records
Tax History Compared to Growth
Tax History
| Year | Tax Paid | Tax Assessment Tax Assessment Total Assessment is a certain percentage of the fair market value that is determined by local assessors to be the total taxable value of land and additions on the property. | Land | Improvement |
|---|---|---|---|---|
| 2025 | $7,432 | $464,679 | $296,882 | $167,797 |
| 2024 | $7,432 | $455,568 | $291,061 | $164,507 |
| 2023 | $7,396 | $446,636 | $285,354 | $161,282 |
| 2022 | $7,148 | $437,879 | $279,759 | $158,120 |
| 2021 | $6,881 | $429,294 | $274,274 | $155,020 |
| 2019 | $6,550 | $416,563 | $266,140 | $150,423 |
| 2018 | $6,610 | $408,396 | $260,922 | $147,474 |
| 2016 | $6,342 | $392,540 | $250,791 | $141,749 |
| 2015 | $6,022 | $386,644 | $247,024 | $139,620 |
| 2014 | $5,949 | $379,072 | $242,186 | $136,886 |
Source: Public Records
Map
Nearby Homes
- 341 Morris Place
- 616 Via Altamira
- 538 N 20th St
- 345 N 20th St
- 601 N Garfield Ave
- 2912 W Via Acosta
- 2429 W Cleveland Ave
- 678 Saybrook Ave
- 3016 W Via Corona
- 113 N 19th St
- 2232 Northside Dr
- 413 Brady Ave
- 1500 Aldea Dr
- 6674 Easton St
- 861 Marconi St
- 833 N 16th St
- 2208 W Olympic Blvd
- 1323 W Lincoln Ave
- 6501 E Olympic Blvd
- 312 E Gleason St
- 2405 W Via Lucia
- 2409 W Via Lucia
- 2404 W Via Acosta
- 501 N Via Val Verde
- 2408 W Via Acosta
- 512 N Via Val Verde
- 516 N Via Val Verde
- 2413 W Via Lucia
- 508 N Via Val Verde
- 2412 W Via Acosta
- 520 N Via Val Verde
- 525 N Via Val Verde
- 504 N Via Val Verde
- 2416 W Via Acosta
- 2417 W Via Lucia
- 524 N Via Val Verde
- 2420 W Via Acosta
- 517 Morris Place
- 500 N Via Val Verde
- 521 Morris Place