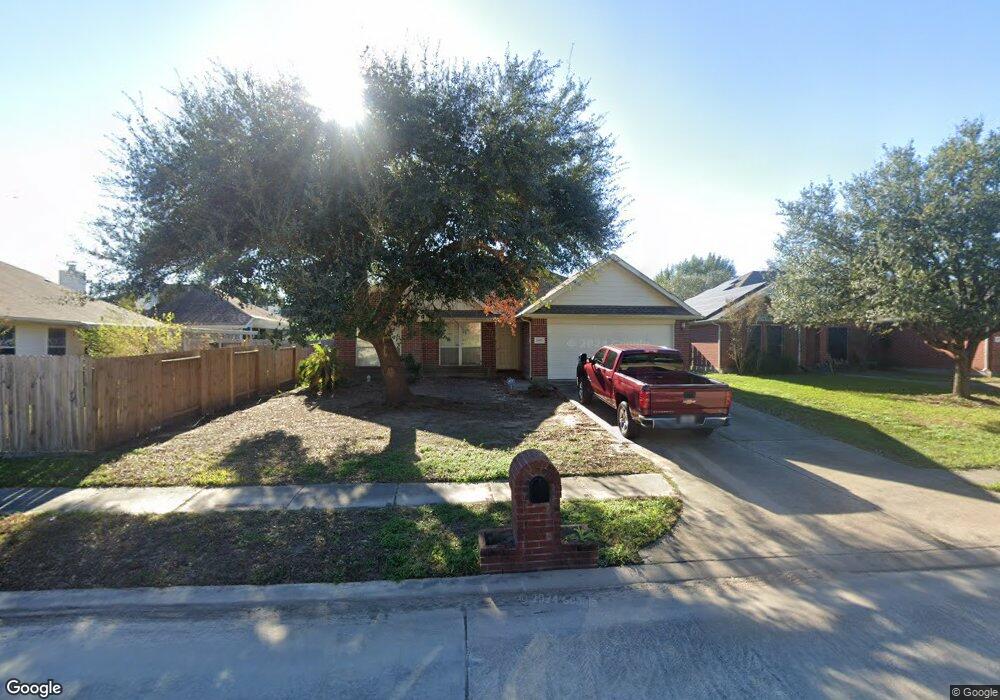
24015 Surreygate Dr Spring, TX 77373
Estimated Value: $226,000 - $231,000
3
Beds
2
Baths
1,616
Sq Ft
$141/Sq Ft
Est. Value
About This Home
This home is located at 24015 Surreygate Dr, Spring, TX 77373 and is currently estimated at $228,482, approximately $141 per square foot. 24015 Surreygate Dr is a home located in Harris County with nearby schools including Chet Burchett Elementary School, Ricky C. Bailey Middle School, and Spring High School.
Ownership History
Date
Name
Owned For
Owner Type
Purchase Details
Closed on
Apr 16, 2007
Sold by
Lasalle Bank Na
Bought by
Finley Terence L
Current Estimated Value
Home Financials for this Owner
Home Financials are based on the most recent Mortgage that was taken out on this home.
Original Mortgage
$86,850
Outstanding Balance
$52,714
Interest Rate
6.22%
Mortgage Type
Purchase Money Mortgage
Estimated Equity
$175,768
Purchase Details
Closed on
Jul 5, 2006
Sold by
Butcher Mitch Allen and Butcher Jackie Carleen
Bought by
Lasalle Bank Na and Structured Asset Securities Corp Structu
Purchase Details
Closed on
Jul 24, 2001
Sold by
Choice Homes Inc
Bought by
Butcher Mitch Allen and Bakri Jackie Carleen
Home Financials for this Owner
Home Financials are based on the most recent Mortgage that was taken out on this home.
Original Mortgage
$117,990
Interest Rate
10.73%
Purchase Details
Closed on
Apr 4, 2001
Sold by
Spring 60 Ltd
Bought by
Choice Homes Inc
Create a Home Valuation Report for This Property
The Home Valuation Report is an in-depth analysis detailing your home's value as well as a comparison with similar homes in the area
Home Values in the Area
Average Home Value in this Area
Purchase History
| Date | Buyer | Sale Price | Title Company |
|---|---|---|---|
| Finley Terence L | -- | Etc | |
| Lasalle Bank Na | $125,000 | None Available | |
| Butcher Mitch Allen | -- | American Title Co | |
| Choice Homes Inc | -- | American Title Co |
Source: Public Records
Mortgage History
| Date | Status | Borrower | Loan Amount |
|---|---|---|---|
| Open | Finley Terence L | $86,850 | |
| Previous Owner | Butcher Mitch Allen | $117,990 |
Source: Public Records
Tax History
| Year | Tax Paid | Tax Assessment Tax Assessment Total Assessment is a certain percentage of the fair market value that is determined by local assessors to be the total taxable value of land and additions on the property. | Land | Improvement |
|---|---|---|---|---|
| 2025 | $6,122 | $240,421 | $43,050 | $197,371 |
| 2024 | $6,122 | $244,598 | $43,050 | $201,548 |
| 2023 | $6,122 | $251,901 | $43,050 | $208,851 |
| 2022 | $5,407 | $219,760 | $19,988 | $199,772 |
| 2021 | $4,660 | $178,763 | $19,988 | $158,775 |
| 2020 | $4,363 | $156,735 | $19,988 | $136,747 |
| 2019 | $4,452 | $154,327 | $19,988 | $134,339 |
| 2018 | $4,144 | $137,203 | $19,988 | $117,215 |
| 2017 | $3,914 | $137,203 | $19,988 | $117,215 |
| 2016 | $3,914 | $137,203 | $19,988 | $117,215 |
| 2015 | $3,531 | $129,115 | $19,988 | $109,127 |
| 2014 | $3,531 | $121,804 | $19,988 | $101,816 |
Source: Public Records
Map
Nearby Homes
- 4919 Tealgate Dr
- 4911 Tealgate Dr
- 4827 Tealgate Dr
- 5026 Forest Hurst Dr
- 23914 Goodfellow Dr
- 4919 Hickorygate Dr
- 23915 Floragate Dr
- 4815 Hickorygate Dr
- 24039 Clipper Hill Ln
- 5110 Forest Terrace Dr
- 23123 Gold Run Dr
- 23815 Firegate Dr
- 24022 Rockygate Dr
- 4831 Blue Jacaranda Way
- 24039 Kentwood Springs Dr
- 23663 Rainbow Eucalyptus Dr
- 4522 Cannongate Dr
- 24046 Kentwood Springs Dr
- 5447 Tuscany Hills Ln
- 3226 Dappled Vale Trail
- 24019 Surreygate Dr
- 4919 Aquagate Dr
- 4915 Aquagate Dr
- 24023 Surreygate Dr
- 24046 Smokeygate Ct
- 4911 Aquagate Dr
- 24050 Smokeygate Ct
- 24014 Surreygate Dr
- 24018 Surreygate Dr
- 4907 Aquagate Dr
- 24027 Surreygate Dr
- 24022 Surreygate Dr
- 24010 Surreygate Dr
- 24042 Smokeygate Ct
- 24051 Smokeygate Ct
- 24026 Surreygate Dr
- 24006 Surreygate Dr
- 4903 Aquagate Dr
- 24031 Surreygate Dr
- 4918 Aquagate Dr
Your Personal Tour Guide
Ask me questions while you tour the home.