
Landlord's Agent in 2017
DMITRY DOMBROVSKY
Real Broker, LLC
(609) 230-6695
19 Total Sales
Estimated Value: $284,033 - $381,000
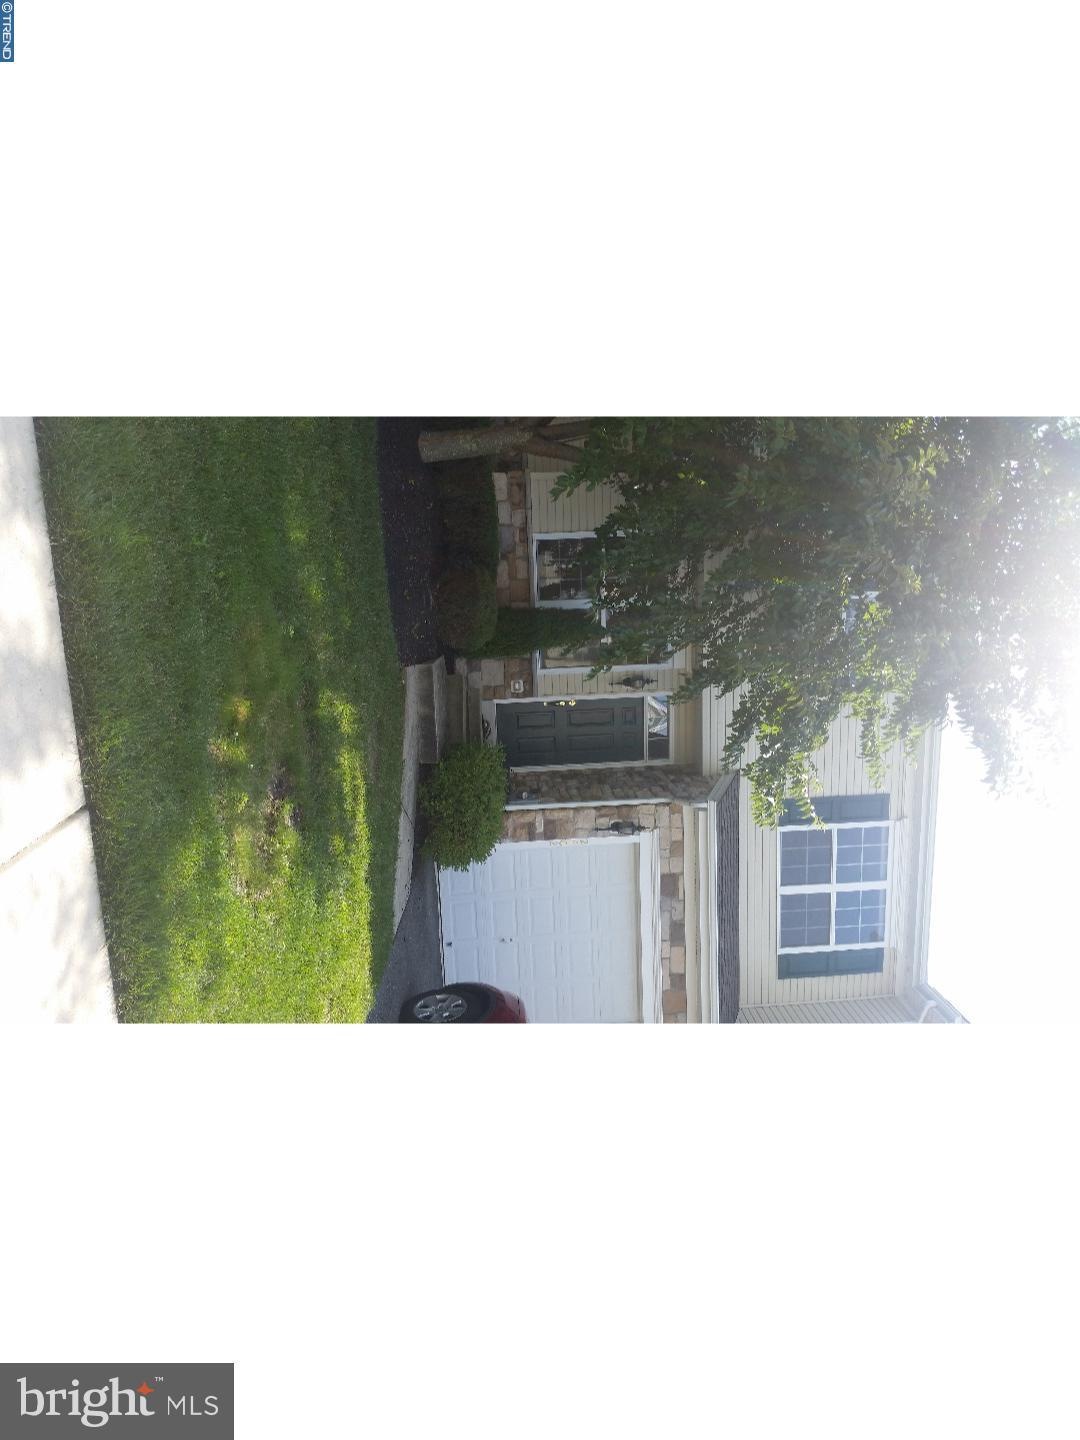
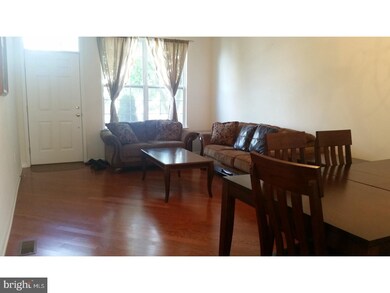
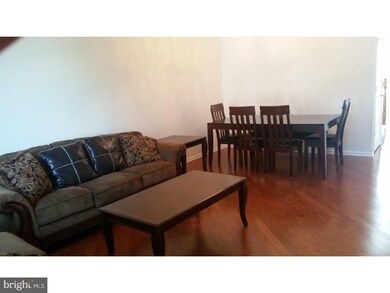
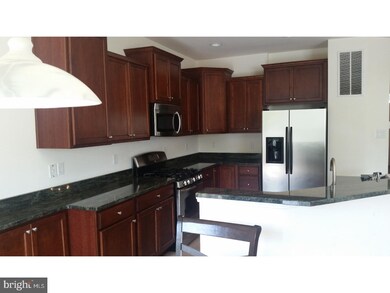
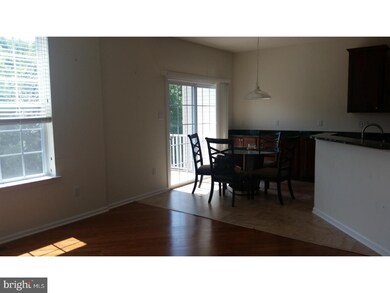
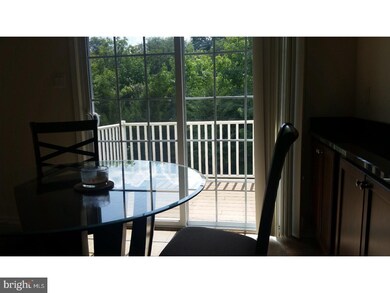
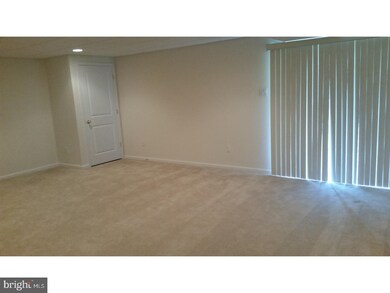
Spacious 3 bedroom, 2 1/2 bath townhouse with garage is centrally located between Philadelphia and the shore points. An open floor plan welcomes you into the formal living room, currently acting as a formal dining area, and into the eat-in kitchen with ample cabinet space that over looks the great room. Slider from the kitchen leads to a patio for grilling and entertaining. Upstairs boasts a large master bedroom with master bath and roomy walk-in closet. You'll also find 2 additional bedrooms, hall bath, and convenient 2nd floor laundry upstairs. Large finished basement with a separate additional storage space. Lawn maintenance, trash and snow removal, clubhouse (includes hall for reserve, pool tables and gym), playground, and swimming pool, covered by HOA and is included in the monthly rent. Tenant is responsible to reimburse the land lord for water/sewer. Make your appointment today!
Last Agent to Rent the Property
(609) 230-6695 dima2388@yahoo.com Real Broker, LLC License #1538534 Listed on: 08/14/2017
Last Renter's Agent
(856) 304-7971 bidingerkimberly@gmail.com RE/MAX Community-Williamstown License #1648175
| Date | Event | Price | List to Sale | Price per Sq Ft |
|---|---|---|---|---|
| 09/01/2017 09/01/17 | Rented | $1,850 | 0.0% | -- |
| 08/23/2017 08/23/17 | Under Contract | -- | -- | -- |
| 08/14/2017 08/14/17 | For Rent | $1,850 | -- | -- |
| Year | Tax Paid | Tax Assessment Tax Assessment Total Assessment is a certain percentage of the fair market value that is determined by local assessors to be the total taxable value of land and additions on the property. | Land | Improvement |
|---|---|---|---|---|
| 2025 | $7,547 | $206,100 | $45,000 | $161,100 |
| 2024 | $7,492 | $206,100 | $45,000 | $161,100 |
| 2023 | $7,492 | $206,100 | $45,000 | $161,100 |
| 2022 | $7,457 | $206,100 | $45,000 | $161,100 |
| 2021 | $7,504 | $206,100 | $45,000 | $161,100 |
| 2020 | $7,496 | $206,100 | $45,000 | $161,100 |
| 2019 | $7,451 | $206,100 | $45,000 | $161,100 |
| 2018 | $7,329 | $206,100 | $45,000 | $161,100 |
| 2017 | $7,555 | $213,300 | $45,000 | $168,300 |
| 2016 | $7,459 | $213,300 | $45,000 | $168,300 |
| 2015 | $7,246 | $213,300 | $45,000 | $168,300 |
| 2014 | $7,035 | $213,300 | $45,000 | $168,300 |
Landlord's Agent in 2017
DMITRY DOMBROVSKY
Real Broker, LLC
(609) 230-6695
19 Total Sales
Tenant's Agent in 2017
Kimberly Bidinger
RE/MAX
(856) 304-7971
4 in this area
31 Total Sales
Source: Bright MLS
MLS Number: 1000054964
APN: 11-00110-0407-00089-0000-C2402
Disclaimer: Certain information contained herein is derived from information provided by parties other than Homes.com. All information provided is deemed reliable, but is not guaranteed to be accurate and should be independently verified.
![]() The data relating to real estate for sale on this website appears in part through the BRIGHT Internet Data Exchange program, a voluntary cooperative exchange of property listing data between licensed real estate brokerage firms, and is provided by BRIGHT through a licensing agreement.
The data relating to real estate for sale on this website appears in part through the BRIGHT Internet Data Exchange program, a voluntary cooperative exchange of property listing data between licensed real estate brokerage firms, and is provided by BRIGHT through a licensing agreement.
Listing information is from various brokers who participate in the Bright MLS IDX program and not all listings may be visible on the site.
The property information being provided on or through the website is for the personal, non-commercial use of consumers and such information may not be used for any purpose other than to identify prospective properties consumers may be interested in purchasing.
Some properties which appear for sale on the website may no longer be available because they are for instance, under contract, sold or are no longer being offered for sale.
Property information displayed is deemed reliable but is not guaranteed.
Copyright 2025 Bright MLS, Inc.