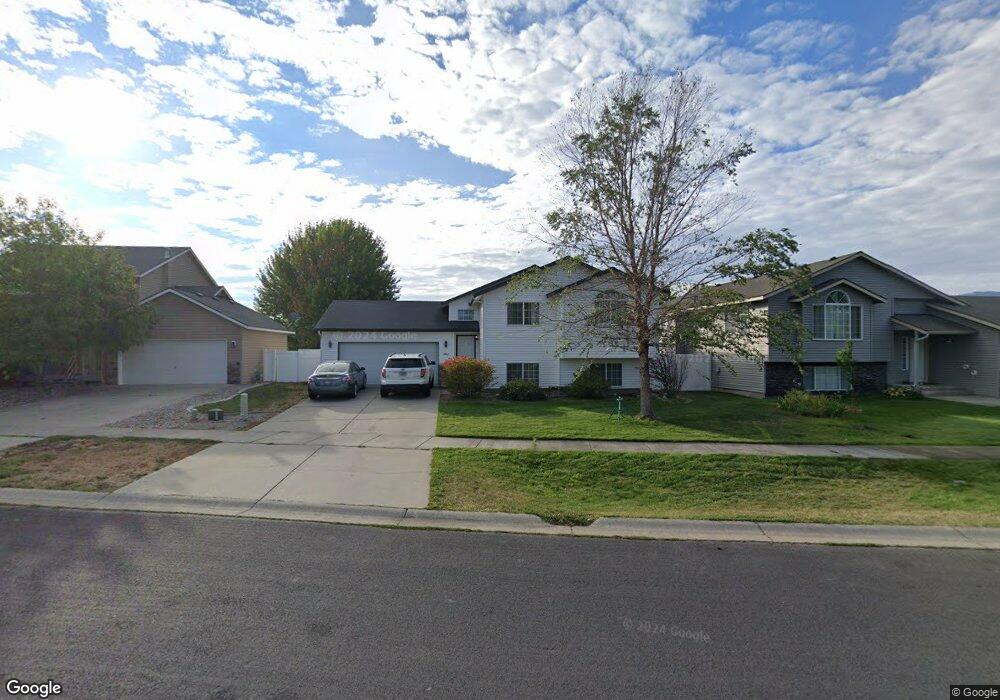
2402 N Bunchgrass Dr Post Falls, ID 83854
North Prairie NeighborhoodEstimated Value: $504,049 - $537,000
4
Beds
2
Baths
2,079
Sq Ft
$250/Sq Ft
Est. Value
About This Home
This home is located at 2402 N Bunchgrass Dr, Post Falls, ID 83854 and is currently estimated at $520,262, approximately $250 per square foot. 2402 N Bunchgrass Dr is a home located in Kootenai County with nearby schools including Prairie View Elementary School, Post Falls Middle School, and Post Falls High School.
Ownership History
Date
Name
Owned For
Owner Type
Purchase Details
Closed on
Aug 2, 2012
Sold by
Steele Norman Wayland and Steele Colene Danae
Bought by
Steele Norman Wayland and Steele Colene Denae
Current Estimated Value
Home Financials for this Owner
Home Financials are based on the most recent Mortgage that was taken out on this home.
Original Mortgage
$157,502
Outstanding Balance
$108,464
Interest Rate
3.62%
Mortgage Type
New Conventional
Estimated Equity
$411,798
Purchase Details
Closed on
Aug 15, 2006
Sold by
Thomson James L
Bought by
Luttge Douglas W and Luttge Jami K
Home Financials for this Owner
Home Financials are based on the most recent Mortgage that was taken out on this home.
Original Mortgage
$143,000
Interest Rate
6.76%
Mortgage Type
New Conventional
Purchase Details
Closed on
Aug 5, 2005
Sold by
Hallmark Homes Inc
Bought by
Thomson James L
Home Financials for this Owner
Home Financials are based on the most recent Mortgage that was taken out on this home.
Original Mortgage
$125,480
Interest Rate
5.46%
Mortgage Type
New Conventional
Create a Home Valuation Report for This Property
The Home Valuation Report is an in-depth analysis detailing your home's value as well as a comparison with similar homes in the area
Home Values in the Area
Average Home Value in this Area
Purchase History
| Date | Buyer | Sale Price | Title Company |
|---|---|---|---|
| Steele Norman Wayland | -- | Kootenai County Title | |
| Luttge Douglas W | -- | -- | |
| Thomson James L | -- | -- |
Source: Public Records
Mortgage History
| Date | Status | Borrower | Loan Amount |
|---|---|---|---|
| Open | Steele Norman Wayland | $157,502 | |
| Previous Owner | Luttge Douglas W | $143,000 | |
| Previous Owner | Thomson James L | $125,480 |
Source: Public Records
Tax History
| Year | Tax Paid | Tax Assessment Tax Assessment Total Assessment is a certain percentage of the fair market value that is determined by local assessors to be the total taxable value of land and additions on the property. | Land | Improvement |
|---|---|---|---|---|
| 2025 | $1,893 | $476,150 | $175,000 | $301,150 |
| 2024 | $1,891 | $464,180 | $152,000 | $312,180 |
| 2023 | $1,891 | $497,155 | $160,000 | $337,155 |
| 2022 | $2,515 | $532,116 | $157,500 | $374,616 |
| 2021 | $2,159 | $336,620 | $105,000 | $231,620 |
| 2020 | $2,241 | $294,870 | $90,000 | $204,870 |
| 2019 | $2,029 | $258,600 | $90,000 | $168,600 |
| 2018 | $1,759 | $223,770 | $70,000 | $153,770 |
| 2017 | $1,562 | $200,060 | $50,000 | $150,060 |
| 2016 | $1,505 | $182,090 | $40,000 | $142,090 |
| 2015 | $1,514 | $179,820 | $37,000 | $142,820 |
| 2013 | $1,334 | $146,190 | $32,000 | $114,190 |
Source: Public Records
Map
Nearby Homes
- 2325 N Mackenzie Dr
- 910 E Shasta Ave
- 2858 N Alfalfa Loop
- 2227 N Chaffee St
- 2238 N Chaffee St
- 1545 E Legion St
- 1401 E Warm Springs Ave
- 2653 E Thrush
- 2489 N Side Saddle Ln
- 2533 N Side Saddle Ln
- 2380 N Baldy Way
- 1412 E Allenby Ave
- 1462 E Allenby Ave
- 1074 E Allenby Ave
- 1042 E Allenby Ave
- 3283 N Segar Loop
- 3294 N Segar Loop
- 3310 N Segar Loop
- 3321 N Segar Loop
- 2815 N Sand Trap Way
- 2376 N Bunchgrass Dr
- 2424 N Bunchgrass Dr
- 2346 N Bunchgrass Dr
- 2440 N Bunchgrass Dr
- 2437 N Alfalfa Loop
- 2415 N Alfalfa Loop
- 2397 N Alfalfa Loop
- 2397 N Bunchgrass Dr
- 2415 N Bunchgrass Dr
- 2459 N Alfalfa Loop
- 2383 N Bunchgrass Dr
- 2458 N Bunchgrass Dr
- 2310 N Bunchgrass Dr
- 2435 N Bunchgrass Dr
- 2379 N Alfalfa Loop
- 2347 N Bunchgrass Dr
- 2453 N Bunchgrass Dr
- 2331 N Bunchgrass Dr
- 2473 N Bunchgrass Dr
- 2512 N Coolwater Dr
Your Personal Tour Guide
Ask me questions while you tour the home.