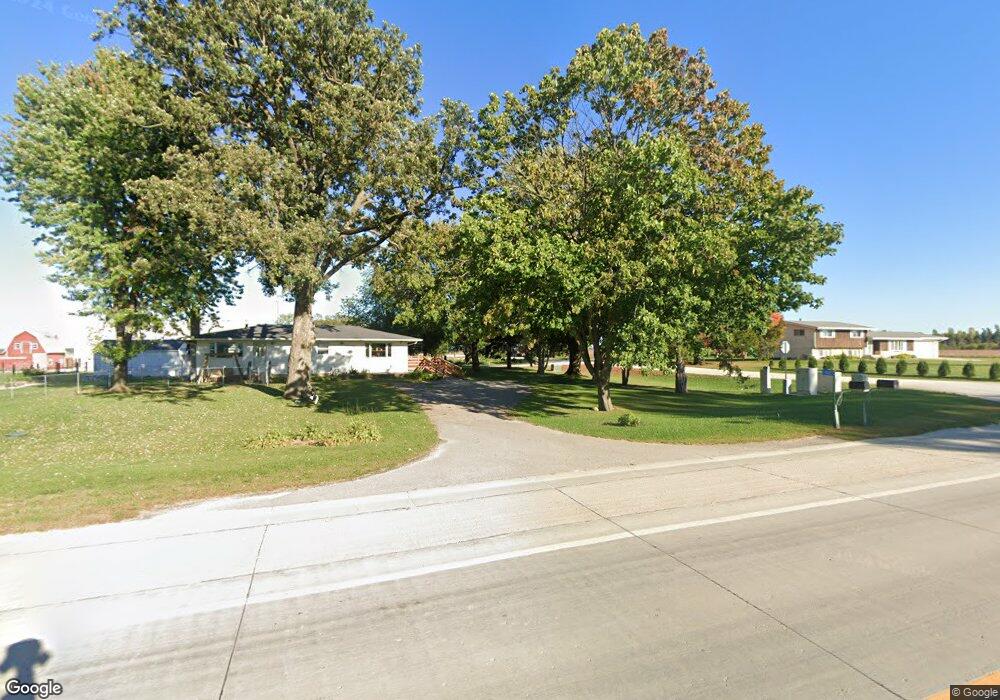
24022 County 1 Spring Valley, MN 55975
Estimated Value: $265,000 - $315,000
3
Beds
1
Bath
2,500
Sq Ft
$116/Sq Ft
Est. Value
About This Home
This home is located at 24022 County 1, Spring Valley, MN 55975 and is currently estimated at $290,981, approximately $116 per square foot. 24022 County 1 is a home located in Fillmore County with nearby schools including Kingsland Elementary School, Kingsland Middle School, and Kingsland Junior/Senior High School.
Ownership History
Date
Name
Owned For
Owner Type
Purchase Details
Closed on
Jan 15, 2025
Sold by
Cornbelt Properties Llc
Bought by
Cornbelt Properties Llc
Current Estimated Value
Purchase Details
Closed on
May 17, 2024
Sold by
Miller Andrew and Miller Barbara
Bought by
Cornbelt Properties Llc
Home Financials for this Owner
Home Financials are based on the most recent Mortgage that was taken out on this home.
Original Mortgage
$150,000
Interest Rate
6.82%
Mortgage Type
New Conventional
Purchase Details
Closed on
Mar 29, 2021
Sold by
Yutzy Nathen E and Yutzy Esther
Bought by
Miller Andrew and Miller Barbara
Home Financials for this Owner
Home Financials are based on the most recent Mortgage that was taken out on this home.
Original Mortgage
$170,850
Interest Rate
2.8%
Mortgage Type
Purchase Money Mortgage
Purchase Details
Closed on
Nov 6, 2019
Sold by
Juday Elaine
Bought by
Yutzy Nathen E and Yutzy Esther
Create a Home Valuation Report for This Property
The Home Valuation Report is an in-depth analysis detailing your home's value as well as a comparison with similar homes in the area
Purchase History
| Date | Buyer | Sale Price | Title Company |
|---|---|---|---|
| Cornbelt Properties Llc | $500 | Legal & Title Services | |
| Cornbelt Properties Llc | $150,000 | -- | |
| Miller Andrew | $201,000 | None Available | |
| Yutzy Nathen E | $200,000 | -- | |
| Miller Andrew Andrew | $201,000 | -- |
Source: Public Records
Mortgage History
| Date | Status | Borrower | Loan Amount |
|---|---|---|---|
| Previous Owner | Cornbelt Properties Llc | $150,000 | |
| Previous Owner | Miller Andrew | $170,850 | |
| Closed | Miller Andrew Andrew | $201,000 |
Source: Public Records
Tax History
| Year | Tax Paid | Tax Assessment Tax Assessment Total Assessment is a certain percentage of the fair market value that is determined by local assessors to be the total taxable value of land and additions on the property. | Land | Improvement |
|---|---|---|---|---|
| 2025 | $1,738 | $250,100 | $73,000 | $177,100 |
| 2024 | $1,738 | $252,500 | $81,500 | $171,000 |
| 2023 | $1,774 | $251,000 | $80,000 | $171,000 |
| 2022 | $1,540 | $224,900 | $118,000 | $106,900 |
| 2021 | $1,540 | $171,300 | $94,200 | $77,100 |
| 2020 | $1,410 | $171,300 | $94,200 | $77,100 |
| 2019 | $1,006 | $176,200 | $93,600 | $82,600 |
| 2018 | $842 | $176,200 | $93,600 | $82,600 |
| 2017 | -- | $161,400 | $84,300 | $77,100 |
| 2016 | $910 | $152,900 | $75,800 | $77,100 |
| 2015 | $1,018 | $141,600 | $71,706 | $69,894 |
| 2014 | $1,018 | $141,400 | $71,520 | $69,880 |
| 2013 | $1,018 | $140,800 | $71,305 | $69,495 |
Source: Public Records
Map
Nearby Homes
- 712 Memorial Dr
- 528 N Broadway St
- 501 Maple Lane Ave
- 321 N Section Ave
- 309 Center Ave
- 313 N Hudson Ave
- 209 N Section Ave
- XXX 256th St
- xxx Highway 63
- 79275 267th St
- 78946 280th St
- 204 Diamond Ct
- 203 Diamond Ct
- 205 Diamond Ct
- 206 Diamond Ct
- 114 Fillmore St E
- 200 Diamond Ct
- 15151 304th St
- TBD Harrison Ave NE
- 16416 County 14
- 24022 County 1
- 24022 County 1
- 24022 County 1
- 23968 County 1
- 24022 24022 Cty Rd 1--
- 24022 Cty Rd 1
- 24022 Cty Rd 1
- 24017 County 1
- 13243 240th St
- 129 E Fairview St
- 125 E Fairview St
- 125 125 Fairview-Street-e
- 121 E Fairview St
- 121 121 Fairview-Street-e
- 109 E Fairview St
- 105 E Fairview St
- 128 E Fairview St
- 101 E Fairview St
- 101 W Fairview St
- 120 E Fairview St
Your Personal Tour Guide
Ask me questions while you tour the home.