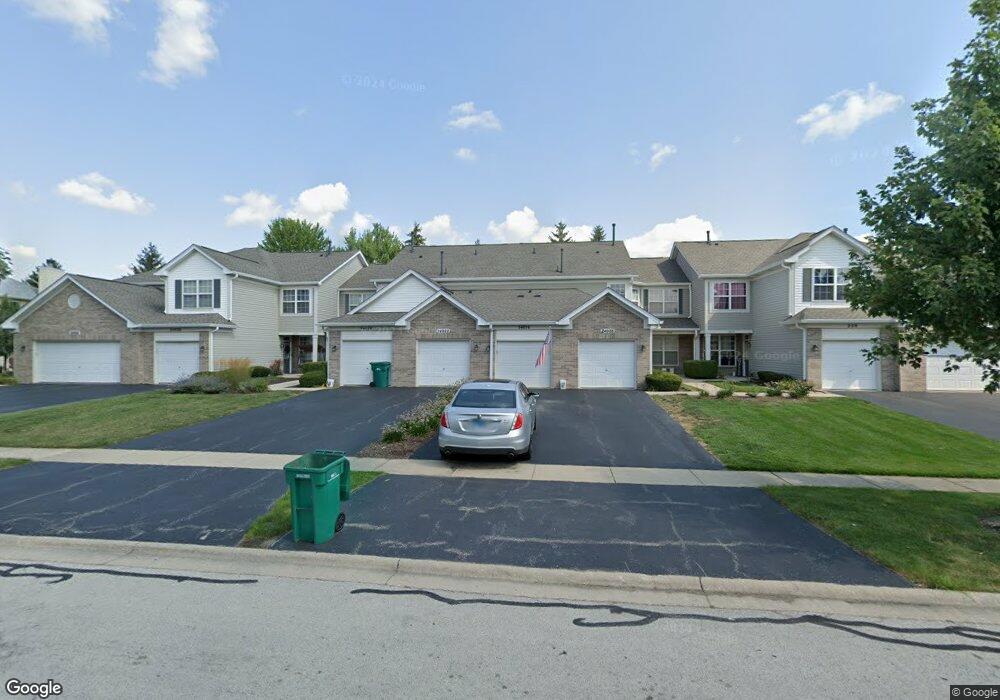
24022 Pear Tree Cir Unit 172103 Plainfield, IL 60585
North Plainfield NeighborhoodEstimated Value: $258,000 - $270,000
--
Bed
1
Bath
1,123
Sq Ft
$235/Sq Ft
Est. Value
About This Home
This home is located at 24022 Pear Tree Cir Unit 172103, Plainfield, IL 60585 and is currently estimated at $264,264, approximately $235 per square foot. 24022 Pear Tree Cir Unit 172103 is a home located in Will County with nearby schools including Eagle Pointe Elementary School, Wentworth Intermediate School, and Heritage Grove Middle School.
Ownership History
Date
Name
Owned For
Owner Type
Purchase Details
Closed on
May 3, 2018
Sold by
Foley Joseph P and Foley Sandra E
Bought by
Taft Barbara J
Current Estimated Value
Home Financials for this Owner
Home Financials are based on the most recent Mortgage that was taken out on this home.
Original Mortgage
$120,000
Outstanding Balance
$103,419
Interest Rate
4.44%
Mortgage Type
Credit Line Revolving
Estimated Equity
$160,845
Purchase Details
Closed on
Oct 16, 2006
Sold by
Whelpley Jenny M
Bought by
Foley Joseph P and Foley Sandra E
Purchase Details
Closed on
Oct 31, 2001
Sold by
Pasquinelli Inc
Bought by
Whelpley Jenny M
Home Financials for this Owner
Home Financials are based on the most recent Mortgage that was taken out on this home.
Original Mortgage
$115,800
Interest Rate
6.72%
Create a Home Valuation Report for This Property
The Home Valuation Report is an in-depth analysis detailing your home's value as well as a comparison with similar homes in the area
Home Values in the Area
Average Home Value in this Area
Purchase History
| Date | Buyer | Sale Price | Title Company |
|---|---|---|---|
| Taft Barbara J | $150,000 | First American Title | |
| Foley Joseph P | $155,000 | None Available | |
| Whelpley Jenny M | $131,000 | Chicago Title Insurance Co |
Source: Public Records
Mortgage History
| Date | Status | Borrower | Loan Amount |
|---|---|---|---|
| Open | Taft Barbara J | $120,000 | |
| Previous Owner | Whelpley Jenny M | $115,800 |
Source: Public Records
Tax History Compared to Growth
Tax History
| Year | Tax Paid | Tax Assessment Tax Assessment Total Assessment is a certain percentage of the fair market value that is determined by local assessors to be the total taxable value of land and additions on the property. | Land | Improvement |
|---|---|---|---|---|
| 2024 | $4,293 | $66,988 | $17,792 | $49,196 |
| 2023 | $4,293 | $59,176 | $15,717 | $43,459 |
| 2022 | $3,553 | $50,337 | $14,868 | $35,469 |
| 2021 | $3,407 | $47,940 | $14,160 | $33,780 |
| 2020 | $3,400 | $47,181 | $13,936 | $33,245 |
| 2019 | $3,340 | $45,851 | $13,543 | $32,308 |
| 2018 | $3,916 | $45,794 | $13,246 | $32,548 |
| 2017 | $3,902 | $44,612 | $12,904 | $31,708 |
| 2016 | $3,916 | $43,651 | $12,626 | $31,025 |
| 2015 | $4,247 | $41,972 | $12,140 | $29,832 |
| 2014 | $4,247 | $45,610 | $12,140 | $33,470 |
| 2013 | $4,247 | $45,610 | $12,140 | $33,470 |
Source: Public Records
Map
Nearby Homes
- 24181 Pear Tree Cir Unit 171206
- 24115 Pear Tree Cir Unit 170807
- 24328 Whispering Trails Dr
- 12929 S Platte Trail
- 23236 W Teton Ln
- 12906 S Slate Ln
- 24333 Leski Ln
- 2711 Lawlor Ln
- 2739 Lawlor Ln
- 2668 Lawlor Ln
- 5943 Polo St
- 5907 Polo St
- 5919 Polo St
- 5911 Polo St
- 11723 Heritage Meadows Dr
- 2547 Tailshot Rd
- 2611 Lawlor Ln
- 2607 Lawlor Ln
- 2547 Mallet Ct
- 2543 Mallet Ct
- 24022 Pear Tree Cir Unit 22
- 24026 Pear Tree Cir Unit 172105
- 24030 Pear Tree Cir Unit 172107
- 24024 Pear Tree Cir Unit 172104
- 24020 Pear Tree Cir Unit 172102
- 24028 Pear Tree Cir Unit 172106
- 24018 Pear Tree Cir Unit 172010
- 24018 Pear Tree Cir Unit 1721
- 24032 Pear Tree Cir Unit 172108
- 24016 W Pear Tree Cir
- 24016 W Pear Tree Cir
- 24050 W Pear Tree Cir Unit 172001
- 24168 Pear Tree Ct Unit 171404
- 24170 Pear Tree Ct Unit 171405
- 24166 Pear Tree Ct Unit 171403
- 24172 Pear Tree Ct Unit 171406
- 24021 Pear Tree Cir Unit 170205
- 24025 W Pear Tree Cir Unit 170203
- 24023 Pear Tree Cir Unit 170204