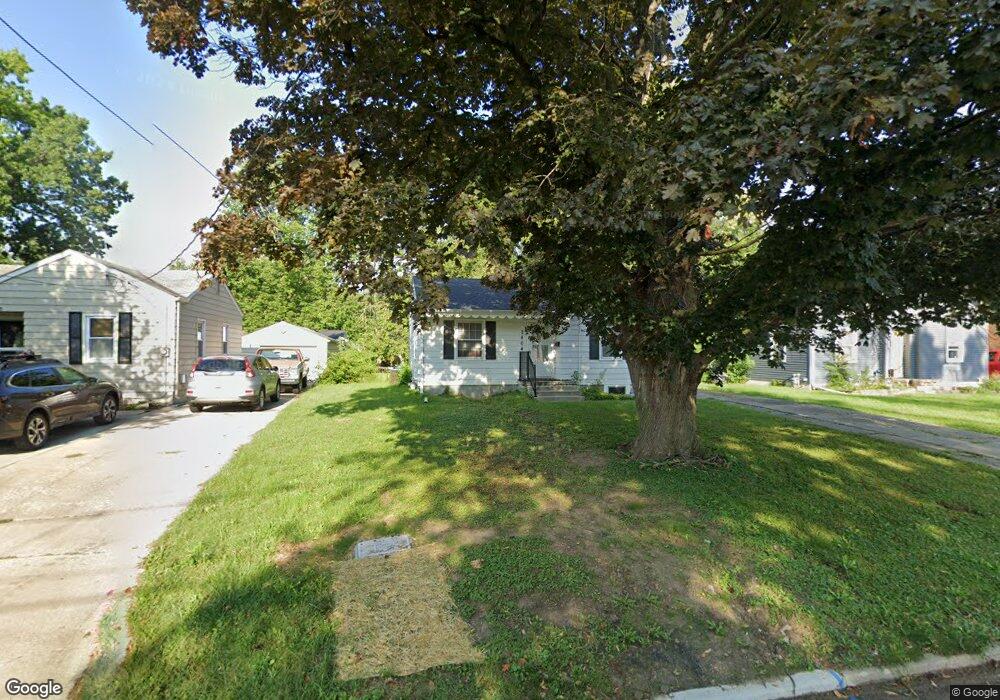
2404 48th St Des Moines, IA 50310
Beaverdale NeighborhoodEstimated Value: $187,000 - $192,000
2
Beds
1
Bath
686
Sq Ft
$277/Sq Ft
Est. Value
About This Home
This home is located at 2404 48th St, Des Moines, IA 50310 and is currently estimated at $189,830, approximately $276 per square foot. 2404 48th St is a home located in Polk County with nearby schools including Hillis Elementary School, Meredith Middle School, and Hoover High School.
Ownership History
Date
Name
Owned For
Owner Type
Purchase Details
Closed on
Sep 18, 2023
Sold by
Gbd Llc
Bought by
Usa Properties Llc
Current Estimated Value
Purchase Details
Closed on
Jun 18, 2019
Sold by
Bbt Rentals Llc
Bought by
Gbd Llc
Purchase Details
Closed on
Jan 9, 2018
Sold by
Oberg Marilyn and Oberg Larry D
Bought by
Bbt Rentals Llc
Create a Home Valuation Report for This Property
The Home Valuation Report is an in-depth analysis detailing your home's value as well as a comparison with similar homes in the area
Home Values in the Area
Average Home Value in this Area
Purchase History
| Date | Buyer | Sale Price | Title Company |
|---|---|---|---|
| Usa Properties Llc | $1,100,000 | None Listed On Document | |
| Gbd Llc | -- | None Available | |
| Bbt Rentals Llc | $75,000 | None Available |
Source: Public Records
Tax History
| Year | Tax Paid | Tax Assessment Tax Assessment Total Assessment is a certain percentage of the fair market value that is determined by local assessors to be the total taxable value of land and additions on the property. | Land | Improvement |
|---|---|---|---|---|
| 2025 | $3,182 | $179,000 | $51,400 | $127,600 |
| 2024 | $3,182 | $161,700 | $45,600 | $116,100 |
| 2023 | $3,192 | $161,700 | $45,600 | $116,100 |
| 2022 | $3,166 | $135,400 | $39,600 | $95,800 |
| 2021 | $3,130 | $135,400 | $39,600 | $95,800 |
| 2020 | $3,250 | $125,400 | $36,400 | $89,000 |
| 2019 | $2,894 | $125,400 | $36,400 | $89,000 |
| 2018 | $2,745 | $107,700 | $31,700 | $76,000 |
| 2017 | $2,472 | $107,700 | $31,700 | $76,000 |
| 2016 | $2,402 | $99,900 | $28,900 | $71,000 |
| 2015 | $2,402 | $99,900 | $28,900 | $71,000 |
| 2014 | $2,465 | $101,700 | $29,000 | $72,700 |
Source: Public Records
Map
Nearby Homes
Your Personal Tour Guide
Ask me questions while you tour the home.