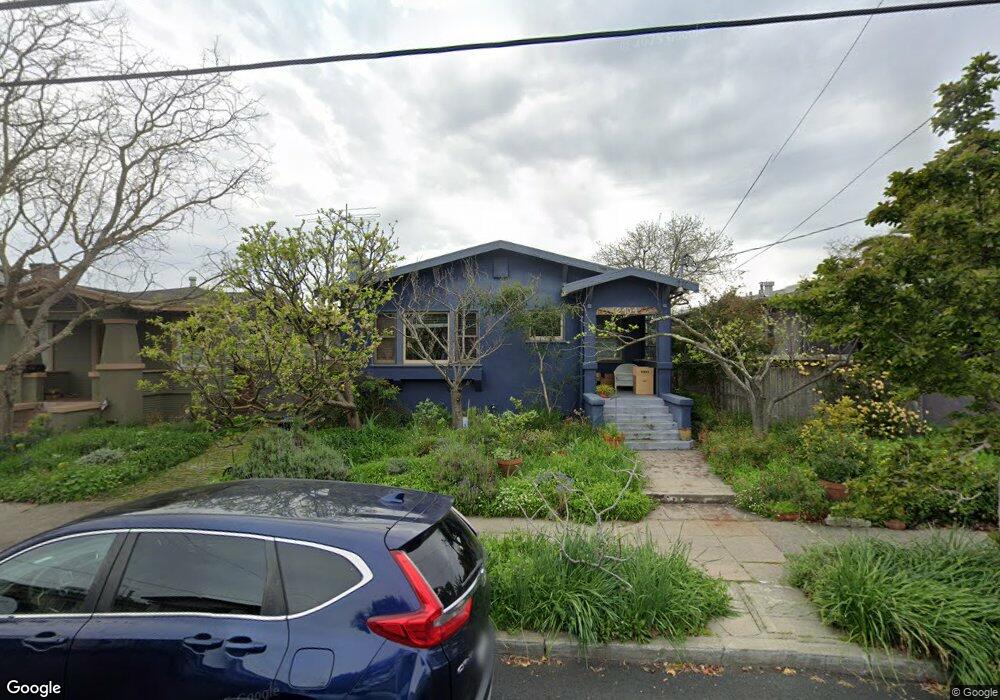
2404 Acton St Berkeley, CA 94702
West Berkeley NeighborhoodEstimated Value: $1,069,000 - $1,280,000
2
Beds
1
Bath
1,282
Sq Ft
$943/Sq Ft
Est. Value
About This Home
This home is located at 2404 Acton St, Berkeley, CA 94702 and is currently estimated at $1,209,162, approximately $943 per square foot. 2404 Acton St is a home located in Alameda County with nearby schools including Washington Elementary School, Oxford Elementary School, and Malcolm X Elementary School.
Ownership History
Date
Name
Owned For
Owner Type
Purchase Details
Closed on
Apr 20, 2012
Sold by
Montang Lisa and Wenig Robert
Bought by
Montang Lisa and Wenig Robert
Current Estimated Value
Purchase Details
Closed on
May 19, 1999
Sold by
Williams Rosalind E and Williams David R
Bought by
Wenig Robert and Montang Lisa
Home Financials for this Owner
Home Financials are based on the most recent Mortgage that was taken out on this home.
Original Mortgage
$208,000
Interest Rate
6.86%
Create a Home Valuation Report for This Property
The Home Valuation Report is an in-depth analysis detailing your home's value as well as a comparison with similar homes in the area
Home Values in the Area
Average Home Value in this Area
Purchase History
| Date | Buyer | Sale Price | Title Company |
|---|---|---|---|
| Montang Lisa | -- | None Available | |
| Wenig Robert | $260,000 | Old Republic Title Company | |
| Carrier Rosalind E | -- | Old Republic Title Company |
Source: Public Records
Mortgage History
| Date | Status | Borrower | Loan Amount |
|---|---|---|---|
| Previous Owner | Wenig Robert | $208,000 | |
| Closed | Wenig Robert | $26,000 |
Source: Public Records
Tax History
| Year | Tax Paid | Tax Assessment Tax Assessment Total Assessment is a certain percentage of the fair market value that is determined by local assessors to be the total taxable value of land and additions on the property. | Land | Improvement |
|---|---|---|---|---|
| 2025 | $8,535 | $455,239 | $122,274 | $339,965 |
| 2024 | $8,535 | $446,177 | $119,877 | $333,300 |
| 2023 | $8,340 | $444,293 | $117,527 | $326,766 |
| 2022 | $8,153 | $428,583 | $115,223 | $320,360 |
| 2021 | $8,146 | $420,044 | $112,964 | $314,080 |
| 2020 | $7,618 | $422,664 | $111,805 | $310,859 |
| 2019 | $7,218 | $414,380 | $109,614 | $304,766 |
| 2018 | $7,074 | $406,256 | $107,465 | $298,791 |
| 2017 | $6,807 | $398,292 | $105,358 | $292,934 |
| 2016 | $6,520 | $390,484 | $103,293 | $287,191 |
| 2015 | $6,423 | $384,619 | $101,741 | $282,878 |
| 2014 | $6,351 | $377,085 | $99,748 | $277,337 |
Source: Public Records
Map
Nearby Homes
- 2350 Sacramento St
- 1142 Dwight Way
- 2324 Browning St
- 1515 Derby St
- 1612 Parker St
- 1118 Dwight Way
- 1645 Dwight Way
- 1612 Carleton St
- 2750 Sacramento St
- 1450 Ward St
- 2758 Sacramento St
- 2774 Sacramento St
- 2782 Sacramento St
- 2790 Sacramento St
- 2231 Byron St
- 1092 Dwight Way
- 1039 Channing Way
- 1530 Stuart St
- 2144 Curtis St
- 2327 10th St Unit 4
- 2412 Acton St
- 2416 Acton St
- 2405 Valley St
- 2403 Valley St
- 2400 Acton St
- 2411 Valley St
- 2420 Acton St
- 1400 Channing Way
- 2415 Valley St
- 2405 Acton St
- 1357 Channing Way
- 2407 Acton St
- 1353 Channing Way
- 1359 Channing Way
- 1351 Channing Way
- 2411 Acton St
- 2419 Valley St
- 1349 Channing Way
- 2415 Acton St
- 2422 Acton St
Your Personal Tour Guide
Ask me questions while you tour the home.