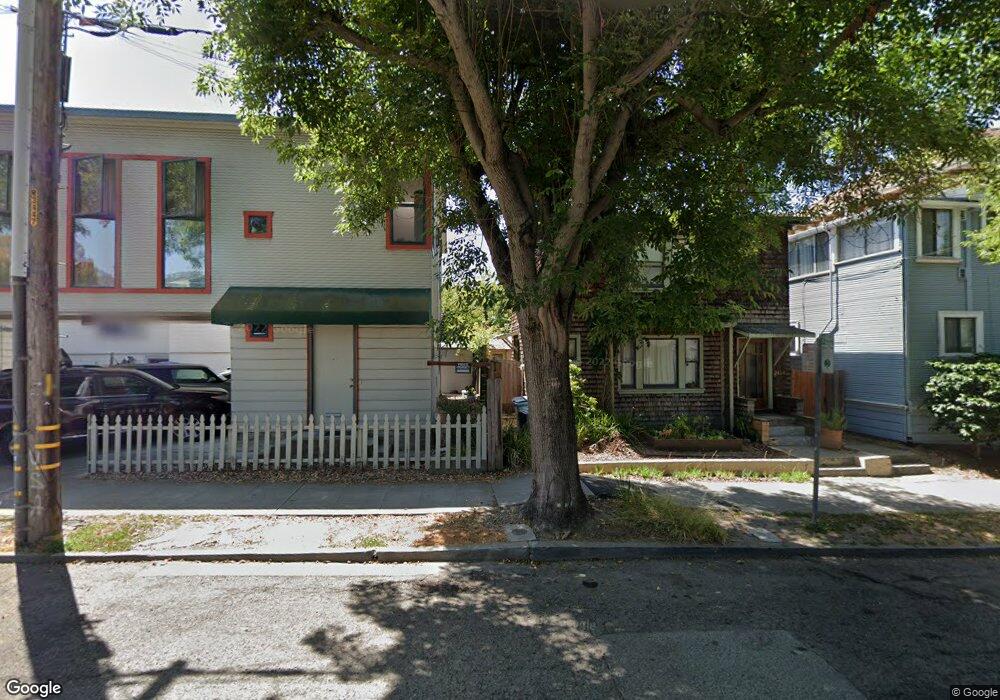
2404 Derby St Berkeley, CA 94705
South Berkeley NeighborhoodEstimated Value: $883,000 - $1,431,000
2
Beds
2
Baths
1,010
Sq Ft
$1,119/Sq Ft
Est. Value
About This Home
This home is located at 2404 Derby St, Berkeley, CA 94705 and is currently estimated at $1,130,650, approximately $1,119 per square foot. 2404 Derby St is a home located in Alameda County with nearby schools including Emerson Elementary School, Malcolm X Elementary School, and John Muir Elementary School.
Ownership History
Date
Name
Owned For
Owner Type
Purchase Details
Closed on
May 20, 2024
Sold by
Cohn Sylviane
Bought by
Sylviane Cohn Trust and Cohn
Current Estimated Value
Purchase Details
Closed on
Feb 20, 2009
Sold by
American Home Mortgage Servicing Inc
Bought by
Cohn Sylvianne
Home Financials for this Owner
Home Financials are based on the most recent Mortgage that was taken out on this home.
Original Mortgage
$175,000
Interest Rate
5.03%
Mortgage Type
Purchase Money Mortgage
Purchase Details
Closed on
Oct 6, 2008
Sold by
Rolston Katherine
Bought by
American Home Mortgage Servicing Inc
Purchase Details
Closed on
Nov 24, 2006
Sold by
Oberdorfer Karen S
Bought by
Rolston Katherine Erin
Home Financials for this Owner
Home Financials are based on the most recent Mortgage that was taken out on this home.
Original Mortgage
$527,250
Interest Rate
1.87%
Mortgage Type
Negative Amortization
Create a Home Valuation Report for This Property
The Home Valuation Report is an in-depth analysis detailing your home's value as well as a comparison with similar homes in the area
Home Values in the Area
Average Home Value in this Area
Purchase History
| Date | Buyer | Sale Price | Title Company |
|---|---|---|---|
| Sylviane Cohn Trust | -- | None Listed On Document | |
| Cohn Sylvianne | $440,000 | Lsi Title Company Ca | |
| American Home Mortgage Servicing Inc | $481,686 | Accommodation | |
| Rolston Katherine Erin | $555,454 | Chicago Title Co |
Source: Public Records
Mortgage History
| Date | Status | Borrower | Loan Amount |
|---|---|---|---|
| Previous Owner | Cohn Sylvianne | $175,000 | |
| Previous Owner | Rolston Katherine Erin | $527,250 |
Source: Public Records
Tax History
| Year | Tax Paid | Tax Assessment Tax Assessment Total Assessment is a certain percentage of the fair market value that is determined by local assessors to be the total taxable value of land and additions on the property. | Land | Improvement |
|---|---|---|---|---|
| 2025 | $8,572 | $559,574 | $169,972 | $396,602 |
| 2024 | $8,572 | $548,468 | $166,640 | $388,828 |
| 2023 | $8,392 | $544,578 | $163,373 | $381,205 |
| 2022 | $8,242 | $526,904 | $160,171 | $373,733 |
| 2021 | $8,259 | $516,437 | $157,031 | $366,406 |
| 2020 | $7,831 | $518,073 | $155,422 | $362,651 |
| 2019 | $7,536 | $507,917 | $152,375 | $355,542 |
| 2018 | $7,410 | $497,960 | $149,388 | $348,572 |
| 2017 | $7,140 | $488,197 | $146,459 | $341,738 |
| 2016 | $6,916 | $478,627 | $143,588 | $335,039 |
| 2015 | $6,825 | $471,441 | $141,432 | $330,009 |
| 2014 | $6,780 | $462,210 | $138,663 | $323,547 |
Source: Public Records
Map
Nearby Homes
- 2702 Dana St
- 2319 Ward St
- 2401 Carleton St
- 2535 Chilton Way
- 2550 Dana St Unit 2F
- 2415 Blake St
- 2935 Florence St
- 2509 Dwight Way
- 2243 Ashby Ave
- 2643 Stuart St
- 2123 Oregon St
- 2923 Wheeler St
- 2601 College Ave Unit 203
- 2601 College Ave Unit 208
- 2110 Ashby Ave
- 2477 Prince St
- 2611 Piedmont Ave Unit 4
- 2632 Warring St Unit 3
- 2918 Newbury St
- 2817 Palm Ct
Your Personal Tour Guide
Ask me questions while you tour the home.