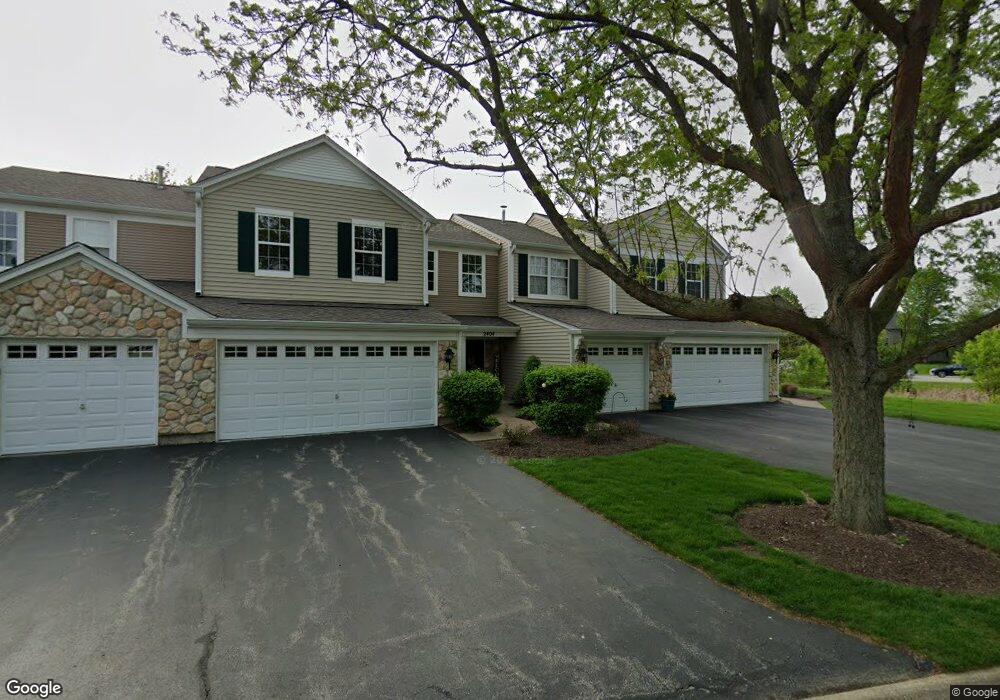
2404 Oak Tree Ln Plainfield, IL 60586
East Plainfield NeighborhoodEstimated Value: $239,677 - $264,000
2
Beds
2
Baths
1,082
Sq Ft
$228/Sq Ft
Est. Value
About This Home
This home is located at 2404 Oak Tree Ln, Plainfield, IL 60586 and is currently estimated at $247,169, approximately $228 per square foot. 2404 Oak Tree Ln is a home located in Will County with nearby schools including River View Elementary School, Timber Ridge Middle School, and Plainfield Central High School.
Ownership History
Date
Name
Owned For
Owner Type
Purchase Details
Closed on
Nov 1, 2007
Sold by
Miekina Catherine M
Bought by
Anderson Gregory W
Current Estimated Value
Home Financials for this Owner
Home Financials are based on the most recent Mortgage that was taken out on this home.
Original Mortgage
$55,000
Interest Rate
6.44%
Mortgage Type
Purchase Money Mortgage
Purchase Details
Closed on
Sep 10, 2004
Sold by
Wilbanks Matthew D and Wilbanks Jessica M
Bought by
Miekina Catherine M
Home Financials for this Owner
Home Financials are based on the most recent Mortgage that was taken out on this home.
Original Mortgage
$127,752
Interest Rate
5.95%
Mortgage Type
FHA
Purchase Details
Closed on
Jul 10, 2001
Sold by
Centex Homes
Bought by
Wilbanks Matthew D and Wilbanks Jessica M
Home Financials for this Owner
Home Financials are based on the most recent Mortgage that was taken out on this home.
Original Mortgage
$112,291
Interest Rate
7.15%
Mortgage Type
FHA
Create a Home Valuation Report for This Property
The Home Valuation Report is an in-depth analysis detailing your home's value as well as a comparison with similar homes in the area
Home Values in the Area
Average Home Value in this Area
Purchase History
| Date | Buyer | Sale Price | Title Company |
|---|---|---|---|
| Anderson Gregory W | $150,000 | Multiple | |
| Miekina Catherine M | $131,500 | Stewart Title Company | |
| Wilbanks Matthew D | $115,000 | Chicago Title Insurance Co |
Source: Public Records
Mortgage History
| Date | Status | Borrower | Loan Amount |
|---|---|---|---|
| Previous Owner | Anderson Gregory W | $55,000 | |
| Previous Owner | Miekina Catherine M | $127,752 | |
| Previous Owner | Wilbanks Matthew D | $112,291 |
Source: Public Records
Tax History
| Year | Tax Paid | Tax Assessment Tax Assessment Total Assessment is a certain percentage of the fair market value that is determined by local assessors to be the total taxable value of land and additions on the property. | Land | Improvement |
|---|---|---|---|---|
| 2024 | $4,080 | $64,963 | $13,476 | $51,487 |
| 2023 | $4,080 | $58,673 | $12,171 | $46,502 |
| 2022 | $3,593 | $51,756 | $10,736 | $41,020 |
| 2021 | $3,391 | $48,370 | $10,034 | $38,336 |
| 2020 | $3,333 | $46,997 | $9,749 | $37,248 |
| 2019 | $3,205 | $44,780 | $9,289 | $35,491 |
| 2018 | $3,052 | $42,073 | $8,727 | $33,346 |
| 2017 | $2,698 | $37,101 | $8,293 | $28,808 |
| 2016 | $2,629 | $35,384 | $7,909 | $27,475 |
| 2015 | $2,458 | $33,147 | $7,409 | $25,738 |
| 2014 | $2,458 | $31,976 | $7,147 | $24,829 |
| 2013 | $2,458 | $31,976 | $7,147 | $24,829 |
Source: Public Records
Map
Nearby Homes
- 4110 Rivertowne Dr
- 2331 Woodhill Ct
- 2350 Woodhill Ct
- 4013 Oak Tree Ln
- 2218 Dalewood Ct
- 2173 Dalewood Ct Unit 3
- 3020 Abbey Cir
- 3005 Abbey Cir
- 3040 Abbey Cir
- 2512 Lockner Blvd
- 3100 Jo Ann Dr
- 3716 Fiday Rd
- 3812 Hennepin Dr
- 2258 Graystone Dr Unit 7340
- 3507 Lake Shore Dr
- 4757 Foster Ct Unit 3
- 2714 Lake Side Cir
- 2949 Woodside Dr Unit 133
- 2914 Woodside Dr Unit 109
- 4022 Hennepin Dr Unit 171
- 2406 Oak Tree Ln
- 2404 Oak Tree Ln Unit 2
- 2408 Oak Tree Ln Unit 1
- 2410 Oak Tree Ln
- 2402 Oak Tree Ln
- 2412 Oak Tree Ln
- 2416 Oak Tree Ln
- 2418 Oak Tree Ln Unit 1
- 2418 Oak Tree Ln Unit 2418
- 2405 Oak Tree Ln Unit 1
- 2420 Oak Tree Ln
- 2407 Oak Tree Ln Unit 1
- 2409 Oak Tree Ln
- 2422 Oak Tree Ln
- 2411 Oak Tree Ln Unit 1
- 2411 Oak Tree Ln
- 2413 Oak Tree Ln
- 2424 Oak Tree Ln Unit 1
- 2415 Oak Tree Ln Unit 1
- 2426 Oak Tree Ln
Your Personal Tour Guide
Ask me questions while you tour the home.