Estimated Value: $221,000 - $271,361
2
Beds
2
Baths
1,040
Sq Ft
$234/Sq Ft
Est. Value
About This Home
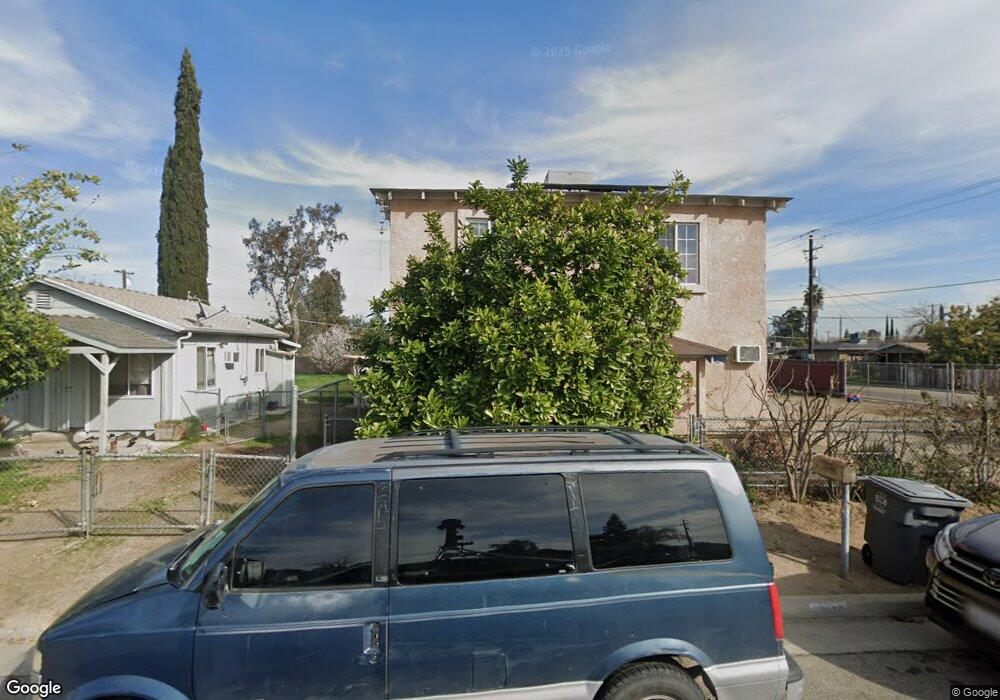
This home is located at 2404 Snyder St, Selma, CA 93662 and is currently estimated at $243,787, approximately $234 per square foot. 2404 Snyder St is a home located in Fresno County with nearby schools including Eric White Elementary School, Abraham Lincoln Middle School, and Selma High School.
Ownership History
Date
Name
Owned For
Owner Type
Purchase Details
Closed on
May 8, 2022
Sold by
Joaquin Reyes
Bought by
Reyes Inocente J and Chavez Anastacia E
Current Estimated Value
Home Financials for this Owner
Home Financials are based on the most recent Mortgage that was taken out on this home.
Original Mortgage
$124,000
Outstanding Balance
$117,818
Interest Rate
5.27%
Mortgage Type
New Conventional
Estimated Equity
$125,969
Purchase Details
Closed on
Dec 28, 2000
Sold by
Joaquin Reyes and Emilio Reyes
Bought by
Reyes Joaquin
Home Financials for this Owner
Home Financials are based on the most recent Mortgage that was taken out on this home.
Original Mortgage
$37,100
Interest Rate
7.41%
Mortgage Type
Purchase Money Mortgage
Purchase Details
Closed on
May 13, 1994
Sold by
Valentin Santiago
Bought by
Reyes Joaquin and Reyes Emilio
Create a Home Valuation Report for This Property
The Home Valuation Report is an in-depth analysis detailing your home's value as well as a comparison with similar homes in the area
Home Values in the Area
Average Home Value in this Area
Purchase History
| Date | Buyer | Sale Price | Title Company |
|---|---|---|---|
| Reyes Inocente J | -- | Chicago Title | |
| Reyes Joaquin | -- | Financial Title Company | |
| Reyes Joaquin | -- | Financial Title Company | |
| Reyes Joaquin | -- | -- |
Source: Public Records
Mortgage History
| Date | Status | Borrower | Loan Amount |
|---|---|---|---|
| Open | Reyes Inocente J | $124,000 | |
| Previous Owner | Reyes Joaquin | $37,100 |
Source: Public Records
Tax History
| Year | Tax Paid | Tax Assessment Tax Assessment Total Assessment is a certain percentage of the fair market value that is determined by local assessors to be the total taxable value of land and additions on the property. | Land | Improvement |
|---|---|---|---|---|
| 2025 | $3,517 | $212,241 | $68,978 | $143,263 |
| 2023 | $2,974 | $204,000 | $66,300 | $137,700 |
| 2022 | $1,733 | $68,504 | $32,336 | $36,168 |
| 2021 | $1,686 | $67,161 | $31,702 | $35,459 |
| 2020 | $1,658 | $66,473 | $31,377 | $35,096 |
| 2019 | $1,604 | $65,170 | $30,762 | $34,408 |
| 2018 | $1,563 | $63,893 | $30,159 | $33,734 |
| 2017 | $1,489 | $62,641 | $29,568 | $33,073 |
| 2016 | $1,357 | $61,414 | $28,989 | $32,425 |
| 2015 | $1,370 | $60,492 | $28,554 | $31,938 |
| 2014 | $1,323 | $59,308 | $27,995 | $31,313 |
Source: Public Records
Map
Nearby Homes
- 2561 Stillman St Unit 111
- 2510 Whitson St
- 2772 Valley View St
- 2753 Thompson Ave
- 2116 Sylvia St
- 2022 Bauder St
- 2226 Arrants St
- 2126 Tulare St
- 2221 Floral Ave
- 2766 Lee St
- 2629 Mccall Ave
- 2662 Yerba St
- 2002 Merced St
- 12623 S Mccall Ave
- 2580 Jackson St
- 1517 Stillman St
- 2222 Barbara St
- 3462 Shaft St
- 1361 Almond St
- 12615 S Mitchell Ave