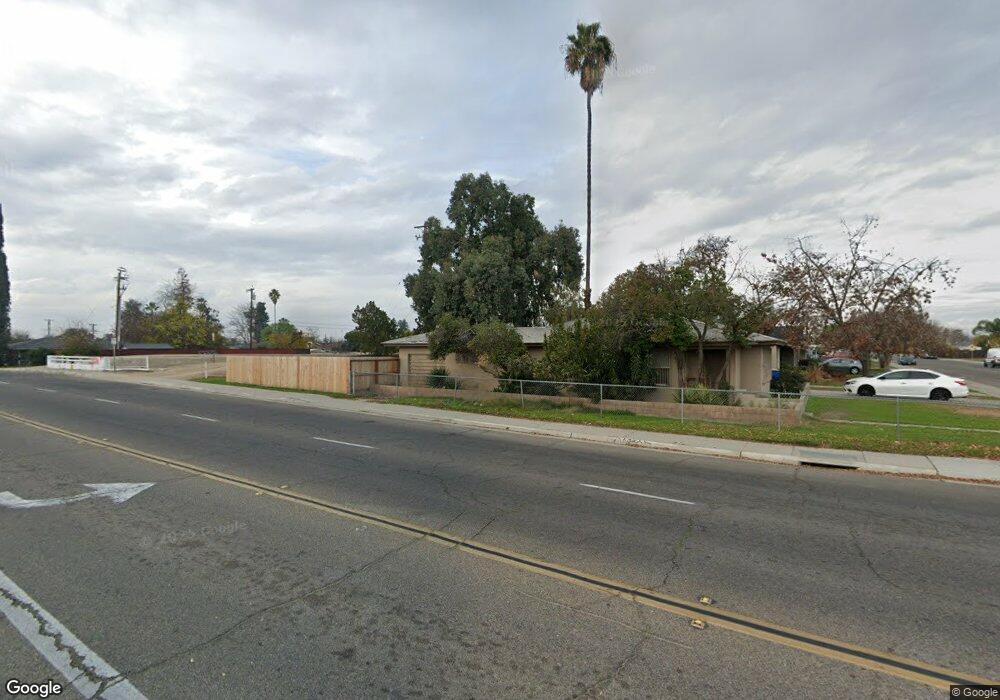
2405 N Millbrook Ave Fresno, CA 93703
McLane NeighborhoodEstimated Value: $276,038 - $331,000
3
Beds
1
Bath
1,304
Sq Ft
$233/Sq Ft
Est. Value
About This Home
This home is located at 2405 N Millbrook Ave, Fresno, CA 93703 and is currently estimated at $303,760, approximately $232 per square foot. 2405 N Millbrook Ave is a home located in Fresno County with nearby schools including Wishon Elementary School, Scandinavian Middle School, and Mclane High School.
Ownership History
Date
Name
Owned For
Owner Type
Purchase Details
Closed on
Sep 18, 2018
Sold by
Classic Homes Inc
Bought by
S Jared Investments Llc
Current Estimated Value
Home Financials for this Owner
Home Financials are based on the most recent Mortgage that was taken out on this home.
Original Mortgage
$1,076,000
Outstanding Balance
$936,403
Interest Rate
4.5%
Mortgage Type
Commercial
Estimated Equity
-$632,643
Purchase Details
Closed on
Apr 28, 2015
Sold by
Mendoza Fred and Mendoza Eva
Bought by
Classic Homes Inc
Purchase Details
Closed on
Feb 26, 1998
Sold by
Graham Gaylord O and Graham Bernice A
Bought by
Mendoza Fred and Mendoza Eva
Home Financials for this Owner
Home Financials are based on the most recent Mortgage that was taken out on this home.
Original Mortgage
$28,000
Interest Rate
7.11%
Create a Home Valuation Report for This Property
The Home Valuation Report is an in-depth analysis detailing your home's value as well as a comparison with similar homes in the area
Home Values in the Area
Average Home Value in this Area
Purchase History
| Date | Buyer | Sale Price | Title Company |
|---|---|---|---|
| S Jared Investments Llc | -- | Fidelity National Title Comp | |
| Classic Homes Inc | $79,500 | None Available | |
| Mendoza Fred | $40,000 | First American Title Co |
Source: Public Records
Mortgage History
| Date | Status | Borrower | Loan Amount |
|---|---|---|---|
| Open | S Jared Investments Llc | $1,076,000 | |
| Previous Owner | Mendoza Fred | $28,000 |
Source: Public Records
Tax History Compared to Growth
Tax History
| Year | Tax Paid | Tax Assessment Tax Assessment Total Assessment is a certain percentage of the fair market value that is determined by local assessors to be the total taxable value of land and additions on the property. | Land | Improvement |
|---|---|---|---|---|
| 2025 | $1,214 | $95,536 | $42,059 | $53,477 |
| 2023 | $1,192 | $91,828 | $40,427 | $51,401 |
| 2022 | $1,176 | $90,029 | $39,635 | $50,394 |
| 2021 | $1,144 | $88,264 | $38,858 | $49,406 |
| 2020 | $1,139 | $147,900 | $45,900 | $102,000 |
| 2019 | $1,836 | $145,000 | $45,000 | $100,000 |
| 2018 | $1,073 | $83,969 | $36,967 | $47,002 |
| 2017 | $1,055 | $82,324 | $36,243 | $46,081 |
| 2016 | $1,021 | $80,711 | $35,533 | $45,178 |
| 2015 | $681 | $53,126 | $23,905 | $29,221 |
| 2014 | -- | $52,086 | $23,437 | $28,649 |
Source: Public Records
Map
Nearby Homes
- 3803 E Clinton Ave
- 3514 Mayfair Dr N
- 2154 Norris Dr E
- 2042 Mayfair Dr E
- 3415 E Terrace Ave
- 3250 E Clinton Ave
- 4054 Arden Dr S
- 2513 N 2nd St
- 2044 Mayfair Dr W
- 3803 E Shields Ave
- 2414 N 1st St
- 2136 N First St
- 2126 N First St
- 2128 N First St
- 3140 E Weldon Ave
- 3256 Mayfair Blvd
- 3243 E Simpson Ave
- 2240
- 0 Tba Unit 634245
- 2904 N First St
- 2415 N Millbrook Ave
- 2425 N Millbrook Ave
- 2361 N Millbrook Ave
- 3733 E Clinton Ave
- 2435 N Millbrook Ave
- 2351 N Millbrook Ave
- 3743 E Clinton Ave
- 3734 E Terrace Ave
- 3728 E Clinton Ave
- 2445 N Millbrook Ave
- 3615 E Clinton Ave
- 3744 E Terrace Ave
- 3753 E Clinton Ave
- 2341 N Millbrook Ave
- 2424 N 6th St
- 3606 E Clinton Ave
- 3738 E Clinton Ave
- 2434 N 6th St
- 3754 E Terrace Ave
- 3763 E Clinton Ave