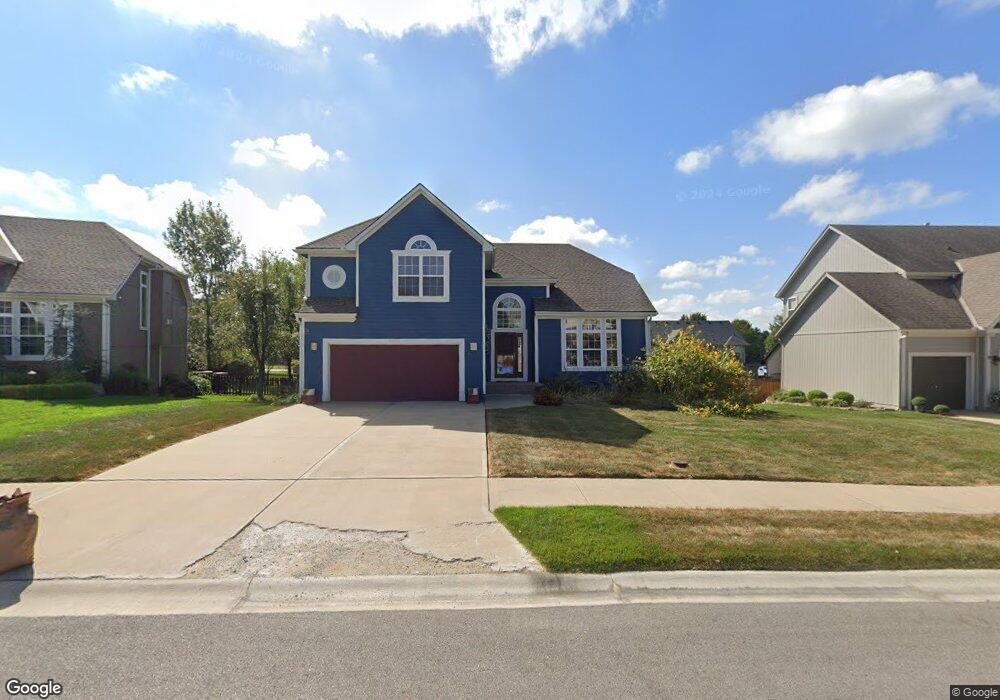
2405 SW Switchback Cir Lees Summit, MO 64082
Estimated Value: $450,000 - $482,000
4
Beds
3
Baths
2,756
Sq Ft
$169/Sq Ft
Est. Value
About This Home
This home is located at 2405 SW Switchback Cir, Lees Summit, MO 64082 and is currently estimated at $464,450, approximately $168 per square foot. 2405 SW Switchback Cir is a home located in Jackson County with nearby schools including Hawthorn Hill Elementary School, Summit Lakes Middle School, and Lee's Summit West High School.
Ownership History
Date
Name
Owned For
Owner Type
Purchase Details
Closed on
Dec 14, 2004
Sold by
D C Olsen Inc
Bought by
Flowers Erlene E
Current Estimated Value
Home Financials for this Owner
Home Financials are based on the most recent Mortgage that was taken out on this home.
Original Mortgage
$156,439
Outstanding Balance
$78,397
Interest Rate
5.74%
Mortgage Type
Stand Alone First
Estimated Equity
$386,053
Purchase Details
Closed on
Apr 23, 2004
Sold by
Hunt Midwest Real Estate Development Inc
Bought by
D C Olsen Inc
Home Financials for this Owner
Home Financials are based on the most recent Mortgage that was taken out on this home.
Original Mortgage
$178,800
Interest Rate
5.81%
Mortgage Type
Construction
Create a Home Valuation Report for This Property
The Home Valuation Report is an in-depth analysis detailing your home's value as well as a comparison with similar homes in the area
Home Values in the Area
Average Home Value in this Area
Purchase History
| Date | Buyer | Sale Price | Title Company |
|---|---|---|---|
| Flowers Erlene E | -- | Security Land Title Company | |
| D C Olsen Inc | -- | -- |
Source: Public Records
Mortgage History
| Date | Status | Borrower | Loan Amount |
|---|---|---|---|
| Open | Flowers Erlene E | $156,439 | |
| Previous Owner | D C Olsen Inc | $178,800 | |
| Closed | Flowers Erlene E | $31,287 |
Source: Public Records
Tax History
| Year | Tax Paid | Tax Assessment Tax Assessment Total Assessment is a certain percentage of the fair market value that is determined by local assessors to be the total taxable value of land and additions on the property. | Land | Improvement |
|---|---|---|---|---|
| 2025 | $5,562 | $79,654 | $14,822 | $64,832 |
| 2024 | $5,521 | $77,026 | $16,728 | $60,298 |
| 2023 | $5,521 | $77,026 | $16,728 | $60,298 |
| 2022 | $4,862 | $60,230 | $7,069 | $53,161 |
| 2021 | $4,963 | $60,230 | $7,069 | $53,161 |
| 2020 | $4,779 | $57,437 | $7,069 | $50,368 |
| 2019 | $4,649 | $57,437 | $7,069 | $50,368 |
| 2018 | $1,613,535 | $49,990 | $6,153 | $43,837 |
| 2017 | $4,360 | $49,990 | $6,153 | $43,837 |
| 2016 | $3,872 | $43,947 | $7,049 | $36,898 |
Source: Public Records
Map
Nearby Homes
- 2400 SW River Spring Rd
- 2328 SW River Spring Rd
- 2533 SW Old Port Rd
- 2712 SW Carlton Dr
- 2205 SW Hawk View Rd
- 2716 SW Regal Dr
- 2707 SW Arthur Dr
- 2615 SW Tracker Ln
- 2322 SW River Trail Rd
- 2614 SW Firefly Ln
- 2124 SW Wheatfield Ct
- 2821 SW Carlton Dr
- 2732 SW Arthur Dr
- 2610 SW Barley Field Dr
- 2622 SW Barley Field Dr
- 2140 SW Gooseberry Ln
- 2750 SW Heartland Rd
- 2230 SW Crown Dr
- 2112 SW Wheatfield Ct
- 2222 SW Crown Dr
- 2407 SW Switchback Cir
- 2403 SW Switchback Cir
- 2416 SW Current Ln
- 2412 SW Current Ln
- 2409 SW Switchback Cir
- 2401 SW Switchback Cir
- 2420 SW Current Ln
- 2408 SW Current Ln
- 2404 SW Switchback Cir
- 2400 SW Switchback Cir
- 2424 SW Current Ln
- 2408 SW Switchback Cir
- 2411 SW Switchback Cir
- 2501 SW Valley Ridge Ln
- 2404 SW Current Ln
- 2500 SW Valley Ridge Ln
- 2428 SW Current Ln
- 2412 SW Switchback Cir
- 2400 SW Current Ln
- 2415 SW Switchback Cir
Your Personal Tour Guide
Ask me questions while you tour the home.