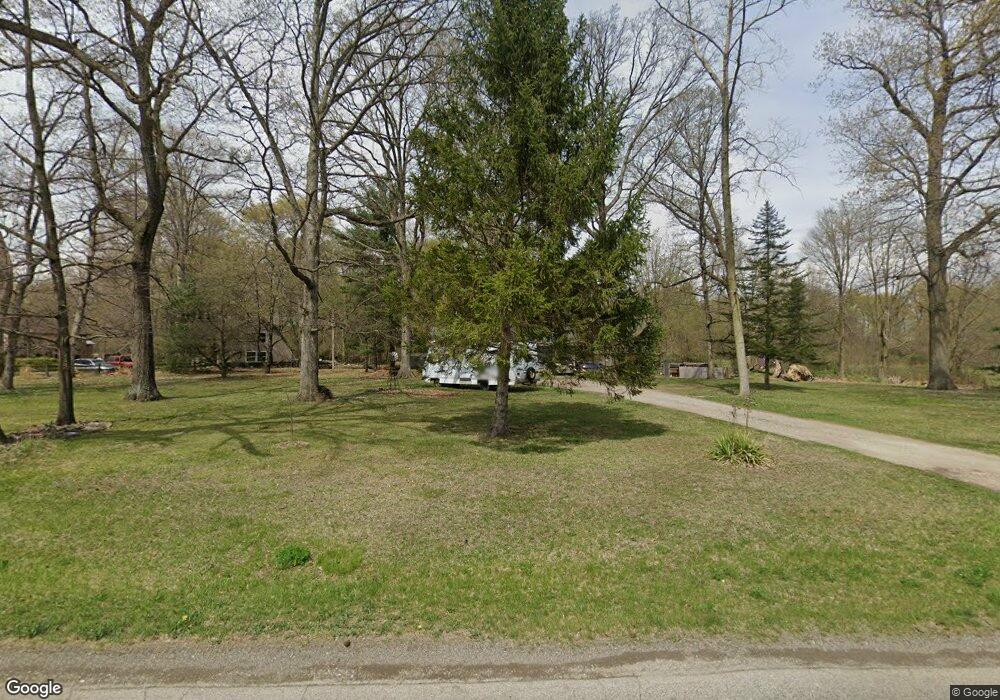
2405 W 700 S Topeka, IN 46571
Estimated Value: $190,000 - $215,489
3
Beds
1
Bath
988
Sq Ft
$211/Sq Ft
Est. Value
About This Home
This home is located at 2405 W 700 S, Topeka, IN 46571 and is currently estimated at $208,622, approximately $211 per square foot. 2405 W 700 S is a home located in LaGrange County with nearby schools including Topeka Elementary School, Westview Elementary School, and Westview Junior/Senior High School.
Ownership History
Date
Name
Owned For
Owner Type
Purchase Details
Closed on
Apr 2, 2018
Sold by
Gonser Jevin D
Bought by
Taylor Rocky L
Current Estimated Value
Home Financials for this Owner
Home Financials are based on the most recent Mortgage that was taken out on this home.
Original Mortgage
$114,964
Outstanding Balance
$98,775
Interest Rate
4.4%
Mortgage Type
New Conventional
Estimated Equity
$109,847
Purchase Details
Closed on
Mar 5, 2012
Sold by
Michael R Aronson
Bought by
Jevin D Gonser
Create a Home Valuation Report for This Property
The Home Valuation Report is an in-depth analysis detailing your home's value as well as a comparison with similar homes in the area
Home Values in the Area
Average Home Value in this Area
Purchase History
| Date | Buyer | Sale Price | Title Company |
|---|---|---|---|
| Taylor Rocky L | $143,705 | Attorney Only | |
| Jevin D Gonser | $85,000 | Lakeland Title Co |
Source: Public Records
Mortgage History
| Date | Status | Borrower | Loan Amount |
|---|---|---|---|
| Open | Taylor Rocky L | $114,964 |
Source: Public Records
Tax History Compared to Growth
Tax History
| Year | Tax Paid | Tax Assessment Tax Assessment Total Assessment is a certain percentage of the fair market value that is determined by local assessors to be the total taxable value of land and additions on the property. | Land | Improvement |
|---|---|---|---|---|
| 2024 | $625 | $153,200 | $30,300 | $122,900 |
| 2023 | $532 | $144,500 | $27,600 | $116,900 |
| 2022 | $489 | $130,400 | $23,100 | $107,300 |
| 2021 | $416 | $114,200 | $22,000 | $92,200 |
| 2020 | $451 | $111,700 | $22,000 | $89,700 |
| 2019 | $372 | $99,600 | $22,000 | $77,600 |
| 2018 | $403 | $103,200 | $22,000 | $81,200 |
| 2017 | $414 | $104,700 | $22,000 | $82,700 |
| 2016 | $345 | $94,400 | $20,000 | $74,400 |
| 2014 | $253 | $85,700 | $23,000 | $62,700 |
| 2013 | $253 | $86,500 | $23,000 | $63,500 |
Source: Public Records
Map
Nearby Homes