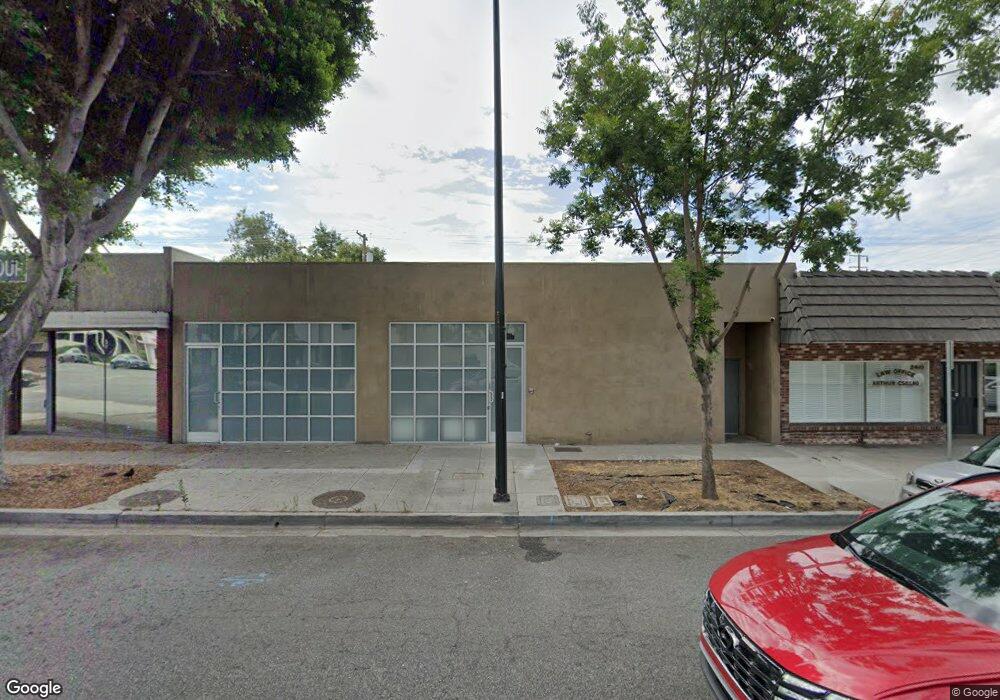
2406 W Magnolia Blvd Burbank, CA 91506
Chandler Park NeighborhoodEstimated Value: $2,230,235
--
Bed
--
Bath
2,600
Sq Ft
$858/Sq Ft
Est. Value
About This Home
This home is located at 2406 W Magnolia Blvd, Burbank, CA 91506 and is currently estimated at $2,230,235, approximately $857 per square foot. 2406 W Magnolia Blvd is a home located in Los Angeles County with nearby schools including Thomas Edison Elementary School, Dolores Huerta Middle School, and John Burroughs High School.
Ownership History
Date
Name
Owned For
Owner Type
Purchase Details
Closed on
Jan 13, 2018
Sold by
Johnson Nancy
Bought by
Johnson Britt R
Current Estimated Value
Purchase Details
Closed on
Mar 17, 2011
Sold by
Wagner Robert J
Bought by
Johnson Britt R and Johnson Nancy
Home Financials for this Owner
Home Financials are based on the most recent Mortgage that was taken out on this home.
Original Mortgage
$428,750
Outstanding Balance
$296,116
Interest Rate
4.9%
Mortgage Type
Commercial
Estimated Equity
$1,934,119
Purchase Details
Closed on
Apr 2, 2007
Sold by
Gottlieb Matilda Suzanne
Bought by
Wagner Robert J and Wagner Pam E
Home Financials for this Owner
Home Financials are based on the most recent Mortgage that was taken out on this home.
Original Mortgage
$490,000
Interest Rate
6.2%
Mortgage Type
Commercial
Create a Home Valuation Report for This Property
The Home Valuation Report is an in-depth analysis detailing your home's value as well as a comparison with similar homes in the area
Home Values in the Area
Average Home Value in this Area
Purchase History
| Date | Buyer | Sale Price | Title Company |
|---|---|---|---|
| Johnson Britt R | -- | Accommodation | |
| Johnson Britt R | $857,500 | Orange Coast Title | |
| Wagner Robert J | $700,000 | First American Title Company |
Source: Public Records
Mortgage History
| Date | Status | Borrower | Loan Amount |
|---|---|---|---|
| Open | Johnson Britt R | $428,750 | |
| Previous Owner | Wagner Robert J | $490,000 |
Source: Public Records
Tax History Compared to Growth
Tax History
| Year | Tax Paid | Tax Assessment Tax Assessment Total Assessment is a certain percentage of the fair market value that is determined by local assessors to be the total taxable value of land and additions on the property. | Land | Improvement |
|---|---|---|---|---|
| 2025 | $12,187 | $1,098,596 | $704,641 | $393,955 |
| 2024 | $12,187 | $1,077,056 | $690,825 | $386,231 |
| 2023 | $12,058 | $1,055,938 | $677,280 | $378,658 |
| 2022 | $11,514 | $1,035,234 | $664,000 | $371,234 |
| 2021 | $11,465 | $1,014,936 | $650,981 | $363,955 |
| 2019 | $11,003 | $984,834 | $631,673 | $353,161 |
| 2018 | $10,852 | $965,525 | $619,288 | $346,237 |
| 2016 | $10,302 | $928,036 | $595,242 | $332,794 |
| 2015 | $10,093 | $914,097 | $586,301 | $327,796 |
| 2014 | $10,061 | $896,192 | $574,817 | $321,375 |
Source: Public Records
Map
Nearby Homes
- 611 N Buena Vista St
- 835 N Lincoln St
- 726 N Keystone St
- 831 N Myers St
- 914 N Catalina St
- 500 N Lamer St
- 825 N Catalina St
- 405 N Brighton St
- 2914 W Chandler Blvd
- 934 N Fairview St
- 930 N Keystone St
- 819 N Fairview St
- 330 N Myers St
- 1121 N Frederic St
- 625 N Niagara St
- 532 N Reese Place
- 1115 N Florence St
- 830 N Reese Place
- 233 N Sparks St
- 1219 N Lincoln St
- 637 N Brighton St
- 2403 W Magnolia Blvd
- 736 N Buena Vista St
- 633 N Brighton St
- 734 N Buena Vista St
- 730 N Buena Vista St
- 629 N Brighton St
- 2320 W Magnolia Blvd
- 728 N Buena Vista St
- 636 N Brighton St
- 625 N Brighton St
- 724 N Buena Vista St
- 2319 W Magnolia Blvd
- 711 N Brighton St
- 634 N Brighton St
- 2317 W Magnolia Blvd
- 810 N Buena Vista St
- 630 N Brighton St
- 720 N Buena Vista St
- 621 N Brighton St