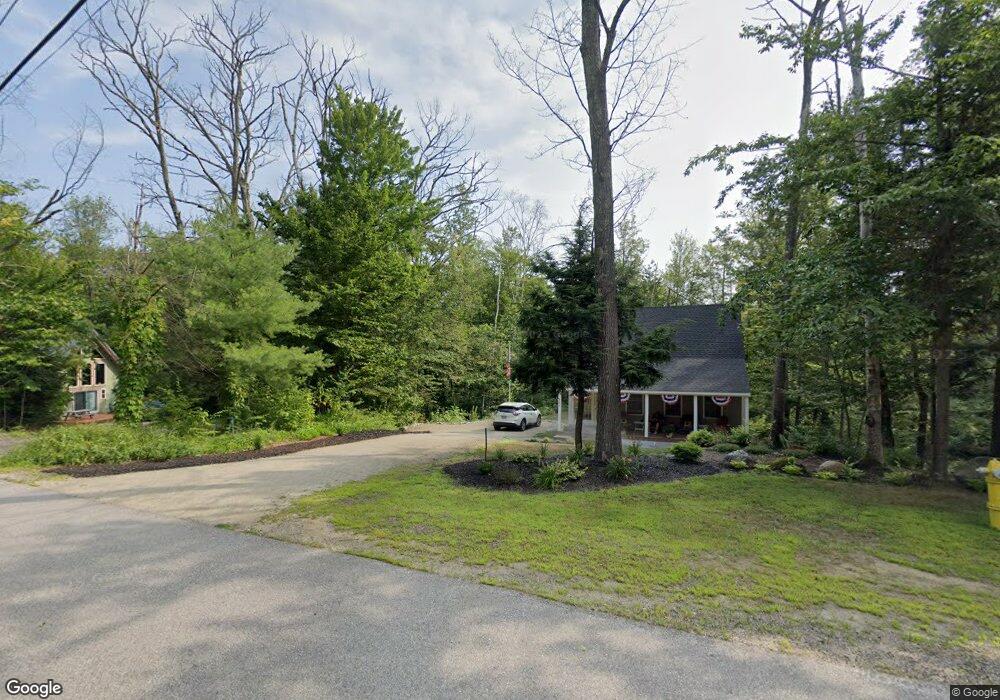
2406 W Side Rd North Conway, NH 03860
Estimated Value: $334,000 - $506,000
4
Beds
2
Baths
1,566
Sq Ft
$272/Sq Ft
Est. Value
About This Home
This home is located at 2406 W Side Rd, North Conway, NH 03860 and is currently estimated at $426,681, approximately $272 per square foot. 2406 W Side Rd is a home located in Carroll County with nearby schools including A. Crosby Kennett Middle School, Kennett High School, and The Lilliputian School.
Ownership History
Date
Name
Owned For
Owner Type
Purchase Details
Closed on
Aug 13, 2024
Sold by
Saco Group Llc
Bought by
Beach Lauren and Beach Douglas
Current Estimated Value
Home Financials for this Owner
Home Financials are based on the most recent Mortgage that was taken out on this home.
Original Mortgage
$265,000
Outstanding Balance
$262,047
Interest Rate
6.95%
Mortgage Type
Purchase Money Mortgage
Estimated Equity
$164,634
Purchase Details
Closed on
Feb 13, 2017
Sold by
Schasel Dean M and Schasel Leslie A
Bought by
Hart Collin J and Flanagan John N
Home Financials for this Owner
Home Financials are based on the most recent Mortgage that was taken out on this home.
Original Mortgage
$82,125
Interest Rate
4.32%
Mortgage Type
Purchase Money Mortgage
Purchase Details
Closed on
Dec 11, 2007
Sold by
Schasel Dean M and Schasel Leslie A
Bought by
Pittsfield Aqueduct Co
Create a Home Valuation Report for This Property
The Home Valuation Report is an in-depth analysis detailing your home's value as well as a comparison with similar homes in the area
Home Values in the Area
Average Home Value in this Area
Purchase History
| Date | Buyer | Sale Price | Title Company |
|---|---|---|---|
| Beach Lauren | $415,000 | None Available | |
| Beach Lauren | $415,000 | None Available | |
| Hart Collin J | $109,533 | -- | |
| Hart Collin J | $109,533 | -- | |
| Pittsfield Aqueduct Co | $35,000 | -- | |
| Pittsfield Aqueduct Co | $35,000 | -- |
Source: Public Records
Mortgage History
| Date | Status | Borrower | Loan Amount |
|---|---|---|---|
| Open | Beach Lauren | $265,000 | |
| Closed | Beach Lauren | $265,000 | |
| Previous Owner | Hart Collin J | $82,125 |
Source: Public Records
Tax History Compared to Growth
Tax History
| Year | Tax Paid | Tax Assessment Tax Assessment Total Assessment is a certain percentage of the fair market value that is determined by local assessors to be the total taxable value of land and additions on the property. | Land | Improvement |
|---|---|---|---|---|
| 2024 | $3,640 | $300,800 | $95,900 | $204,900 |
| 2023 | $3,282 | $300,800 | $95,900 | $204,900 |
| 2022 | $2,976 | $164,800 | $71,600 | $93,200 |
| 2021 | $2,693 | $164,800 | $71,600 | $93,200 |
| 2020 | $2,858 | $164,800 | $71,600 | $93,200 |
| 2019 | $2,854 | $164,800 | $71,600 | $93,200 |
| 2018 | $2,419 | $115,900 | $61,600 | $54,300 |
| 2017 | $2,316 | $115,900 | $61,600 | $54,300 |
| 2016 | $2,354 | $121,900 | $61,600 | $60,300 |
| 2015 | $2,327 | $121,900 | $61,600 | $60,300 |
| 2014 | $2,639 | $139,900 | $61,600 | $78,300 |
| 2013 | $2,538 | $142,100 | $61,600 | $80,500 |
Source: Public Records
Map
Nearby Homes
- 2318 W Side Rd
- 2280 W Side Rd
- 63 Allard Farm Circuit
- 262 Beechnut Dr
- 50 Nina Ln
- 10 Elm Brook Rd Unit 9
- 7 Fairway Dr
- 00 Artist Falls Rd
- 00 White Mountain Hwy
- 2760 New Hampshire 16 Unit E008A Week 29
- 2906 White Mountain Hwy
- 3002 White Mountain Hwy Unit Lots 29 and 30 - 300
- 85 Amethyst Hill Rd
- 2955 White Mountain Hwy Unit 106 (W5)
- 2955 White Mountain Hwy Unit 123 (E20)
- 2955 White Mountain Hwy Unit 204 W28
- 2955 White Mountain Hwy Unit 114 (W25)
- 2955 White Mountain Hwy Unit 207 (W-31)
- 58 Crossbow Ln
- 56 Forest Park Way Unit 19
- 2406 W Side Rd
- 165 Allard Farm Circuit
- 2396 W Side Rd
- 2422 W Side Rd
- 197 Allard Farm Circuit
- 2390 W Side Rd
- 231-56 Allard Farm Circuit Unit 231, 56
- 231-71 Allard Farm Circuit Unit 231, 71
- 2405 W Side Rd
- 2378 W Side Rd
- 0 Allard Farm Circuit
- 2423 W Side Rd
- 203 Allard Farm Circuit
- 2444 W Side Rd
- 155 Allard Farm Circuit
- 2370 W Side Rd
- 202 Allard Farm Circuit
- 184 Allard Farm Circuit
- 227 Allard Farm Circuit
- 170 Allard Farm Circuit