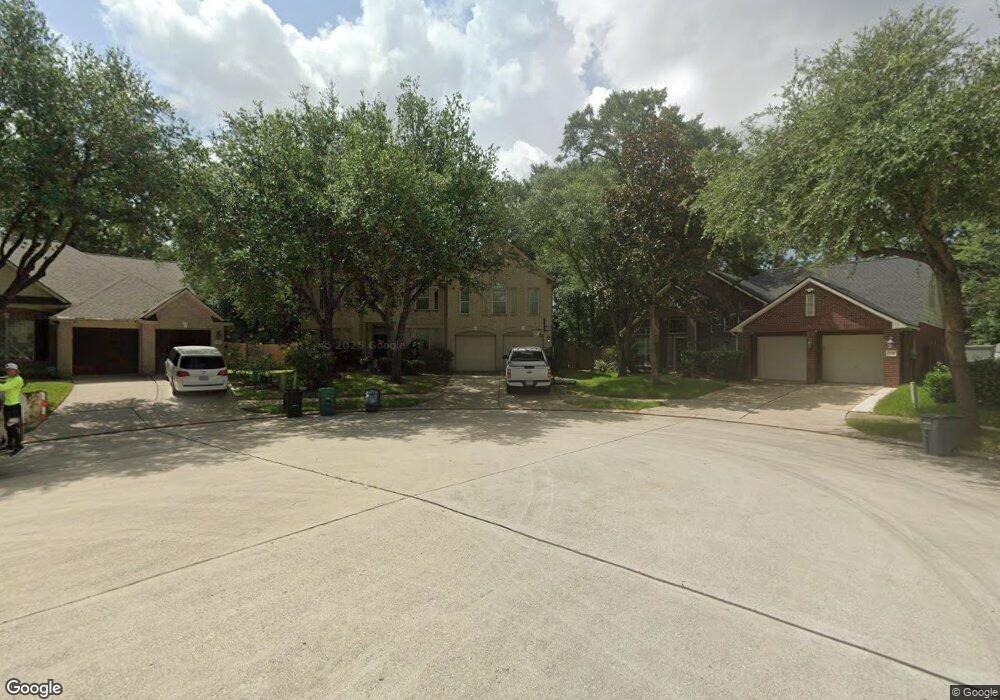
2406 Windcrest Park Ct Spring, TX 77386
Imperial Oaks NeighborhoodEstimated Value: $410,377 - $464,000
Studio
1
Bath
3,106
Sq Ft
$143/Sq Ft
Est. Value
About This Home
This home is located at 2406 Windcrest Park Ct, Spring, TX 77386 and is currently estimated at $443,344, approximately $142 per square foot. 2406 Windcrest Park Ct is a home located in Montgomery County with nearby schools including Kaufman Elementary School, Vogel Intermediate School, and Irons J High School.
Ownership History
Date
Name
Owned For
Owner Type
Purchase Details
Closed on
Jun 29, 2015
Sold by
Myers James C and Myers Ingrid S
Bought by
Murphy Dakota and Murphy Rachel
Current Estimated Value
Home Financials for this Owner
Home Financials are based on the most recent Mortgage that was taken out on this home.
Original Mortgage
$260,200
Outstanding Balance
$202,108
Interest Rate
3.91%
Mortgage Type
FHA
Estimated Equity
$241,236
Purchase Details
Closed on
May 13, 2005
Sold by
Mhi Partnership Ltd
Bought by
Myers James C and Myers Ingrid S
Home Financials for this Owner
Home Financials are based on the most recent Mortgage that was taken out on this home.
Original Mortgage
$135,053
Interest Rate
6.03%
Mortgage Type
Fannie Mae Freddie Mac
Purchase Details
Closed on
Oct 11, 2004
Sold by
Imperial Oaks No 3 Ltd
Bought by
Murphy Dakota and Murphy Rachel
Create a Home Valuation Report for This Property
The Home Valuation Report is an in-depth analysis detailing your home's value as well as a comparison with similar homes in the area
Home Values in the Area
Average Home Value in this Area
Purchase History
| Date | Buyer | Sale Price | Title Company |
|---|---|---|---|
| Murphy Dakota | -- | None Available | |
| Myers James C | -- | Millennium Title Houston | |
| Murphy Dakota | -- | -- |
Source: Public Records
Mortgage History
| Date | Status | Borrower | Loan Amount |
|---|---|---|---|
| Open | Murphy Dakota | $260,200 | |
| Previous Owner | Myers James C | $135,053 |
Source: Public Records
Tax History
| Year | Tax Paid | Tax Assessment Tax Assessment Total Assessment is a certain percentage of the fair market value that is determined by local assessors to be the total taxable value of land and additions on the property. | Land | Improvement |
|---|---|---|---|---|
| 2025 | $9,402 | $410,384 | $68,000 | $342,384 |
| 2024 | $8,653 | $412,634 | $68,000 | $344,634 |
| 2023 | $8,653 | $372,240 | $68,000 | $304,240 |
| 2022 | $9,167 | $358,760 | $25,000 | $333,760 |
| 2021 | $7,593 | $274,840 | $25,000 | $249,840 |
| 2020 | $7,953 | $275,760 | $25,000 | $250,760 |
| 2019 | $8,197 | $276,530 | $25,000 | $251,530 |
| 2018 | $7,707 | $260,000 | $25,000 | $235,000 |
| 2017 | $7,752 | $260,000 | $25,000 | $235,000 |
| 2016 | $7,678 | $257,500 | $25,000 | $232,500 |
| 2015 | $5,947 | $226,170 | $25,000 | $219,780 |
| 2014 | $5,947 | $205,610 | $25,000 | $203,160 |
Source: Public Records
Map
Nearby Homes
- 2511 Bridgestone Park Ln
- 31214 Windcrest Park Ln
- 2618 Bridgestone Park Ln
- 31243 Quail Oak Park Ln
- 2710 Fountainbrook Park Ct
- 31419 Fountainbrook Park Ln
- 30719 Aldine Westfield Rd
- 2907 Bright Sky Ct
- 31410 Ashland Park Ln
- 32334 Willow Creek Park
- 2954 Smokey Forest Ln
- 30715 Eastridge Dr
- 1927 Enchanted Park Dr
- 2611 Winding Creek Way
- 32119 Archer Park
- 30615 Winlock Trails Dr
- 2707 Oak Pass Ct
- 2898 Woodland Glen Ln
- 2202 Stoneycreek Park Ct
- 32510 Sweetgum Hollow Ct
- 2410 Windcrest Park Ct
- 2403 Windcrest Park Ct
- 2414 Windcrest Park Ct
- 2407 Windcrest Park Ct
- 2502 Kenwood Park Ln
- 2411 Windcrest Park Ct
- 2415 Windcrest Park Ct
- 2503 Bridgestone Park Ln
- 2506 Kenwood Park Ln
- 2427 Bridgestone Park Ln
- 2515 Bridgestone Park Ln
- 31202 Windcrest Park Ln
- 31211 Windcrest Park Ln
- 2510 Kenwood Park Ln
- 31206 Windcrest Park Ln
- 2503 Kenwood Park Ln
- 2423 Bridgestone Park Ln
- 2519 Bridgestone Park Ln
- 31210 Windcrest Park Ln
- 31215 Windcrest Park Ln
Your Personal Tour Guide
Ask me questions while you tour the home.