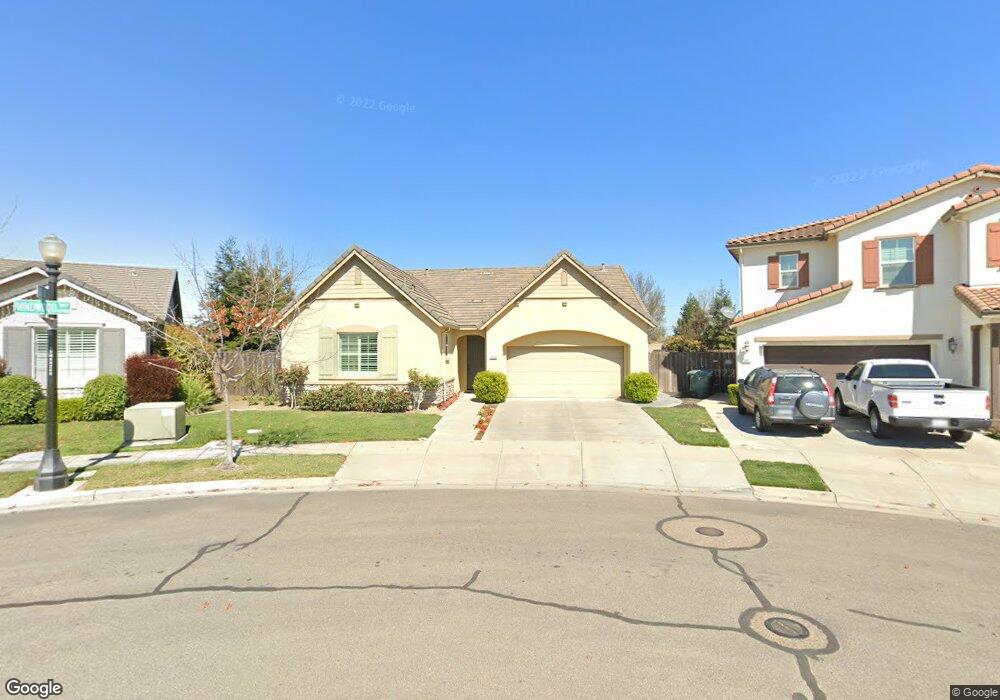
2406 Windwood Way Oakdale, CA 95361
Estimated Value: $507,719 - $578,000
4
Beds
2
Baths
1,863
Sq Ft
$288/Sq Ft
Est. Value
About This Home
This home is located at 2406 Windwood Way, Oakdale, CA 95361 and is currently estimated at $536,180, approximately $287 per square foot. 2406 Windwood Way is a home located in Stanislaus County with nearby schools including Fair Oaks Elementary School, Oakdale Junior High School, and East Stanislaus High School.
Ownership History
Date
Name
Owned For
Owner Type
Purchase Details
Closed on
Jan 21, 2020
Sold by
Porter Mark
Bought by
Porter Michelle Lee
Current Estimated Value
Home Financials for this Owner
Home Financials are based on the most recent Mortgage that was taken out on this home.
Original Mortgage
$289,000
Outstanding Balance
$255,981
Interest Rate
3.73%
Mortgage Type
Commercial
Estimated Equity
$280,199
Purchase Details
Closed on
Jun 27, 2011
Sold by
Oakdale Building Partners Ii Lp
Bought by
Dunn Diana
Home Financials for this Owner
Home Financials are based on the most recent Mortgage that was taken out on this home.
Original Mortgage
$65,650
Interest Rate
4.75%
Mortgage Type
FHA
Create a Home Valuation Report for This Property
The Home Valuation Report is an in-depth analysis detailing your home's value as well as a comparison with similar homes in the area
Home Values in the Area
Average Home Value in this Area
Purchase History
| Date | Buyer | Sale Price | Title Company |
|---|---|---|---|
| Porter Michelle Lee | -- | Chicago Title Company | |
| Porter Michelle Lee | $389,000 | Chicago Title Company | |
| Dunn Diana | -- | Old Republic Title Company |
Source: Public Records
Mortgage History
| Date | Status | Borrower | Loan Amount |
|---|---|---|---|
| Open | Porter Michelle Lee | $289,000 | |
| Previous Owner | Dunn Diana | $65,650 |
Source: Public Records
Tax History Compared to Growth
Tax History
| Year | Tax Paid | Tax Assessment Tax Assessment Total Assessment is a certain percentage of the fair market value that is determined by local assessors to be the total taxable value of land and additions on the property. | Land | Improvement |
|---|---|---|---|---|
| 2025 | $5,716 | $425,422 | $120,298 | $305,124 |
| 2024 | $5,455 | $417,082 | $117,940 | $299,142 |
| 2023 | $5,346 | $408,905 | $115,628 | $293,277 |
| 2022 | $5,246 | $400,888 | $113,361 | $287,527 |
| 2021 | $5,145 | $393,029 | $111,139 | $281,890 |
| 2020 | $3,473 | $238,972 | $58,570 | $180,402 |
| 2019 | $3,408 | $234,287 | $57,422 | $176,865 |
| 2018 | $3,344 | $229,695 | $56,297 | $173,398 |
| 2017 | $3,289 | $225,193 | $55,194 | $169,999 |
| 2016 | $3,237 | $220,778 | $54,112 | $166,666 |
| 2015 | $3,200 | $217,463 | $53,300 | $164,163 |
| 2014 | $3,169 | $213,204 | $52,256 | $160,948 |
Source: Public Records
Map
Nearby Homes
- 311 Carriage Ln
- 2532 Laurel Ridge Ct
- 2306 W F St
- The Skyline Plan at Saddlewood
- The Pinnacle Plan at Saddlewood
- The Vantage Plan at Saddlewood
- 2908 Westport Cir
- 2272 Tori Way
- 2319 Tori Way
- 2376 Shire Way
- 549 Fresian Dr
- 2337 Rainwood Ln
- 2201 Mustang Dr
- 15 Willowood Dr
- 2637 Morgan St
- 8400 Crane Rd
- 1972 Sugar Pine Dr
- 1948 Sugar Pine Dr
- 602 Criolla Dr
- 2030 Baluchi Way
- 2422 Windwood Way
- 307 Merlot Dr
- 320 Rivergate Dr
- 2438 Windwood Way
- 315 Merlot Dr
- 328 Rivergate Dr
- 2388 Mendocino Dr
- 323 Merlot Dr
- 2454 Windwood Way
- 336 Rivergate Dr
- 312 Merlot Dr
- 324 Merlot Dr
- 2380 Mendocino Dr
- 344 Rivergate Dr
- 331 Merlot Dr
- 2470 Windwood Way
- 336 Merlot Dr
- 2377 Mendocino Dr
- 352 Rivergate Dr
- 2372 Mendocino Dr