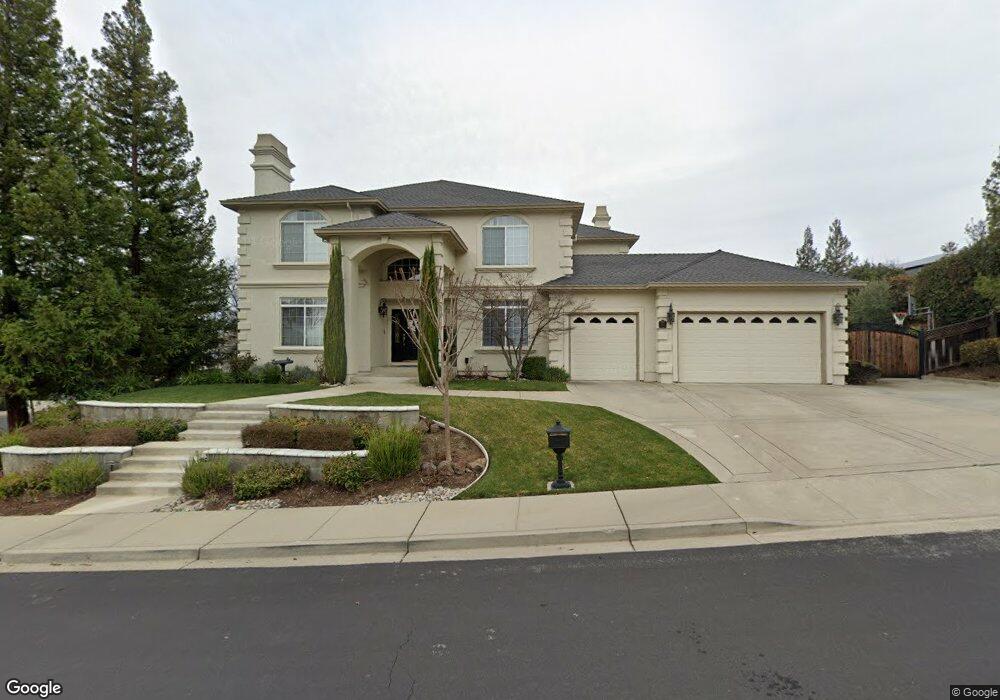
2408 Upland Ct Livermore, CA 94550
Shadowbrook NeighborhoodEstimated Value: $2,410,000 - $2,543,000
4
Beds
3
Baths
3,500
Sq Ft
$711/Sq Ft
Est. Value
About This Home
This home is located at 2408 Upland Ct, Livermore, CA 94550 and is currently estimated at $2,489,949, approximately $711 per square foot. 2408 Upland Ct is a home located in Alameda County with nearby schools including William Mendenhall Middle School, Granada High School, and St Michael's School.
Ownership History
Date
Name
Owned For
Owner Type
Purchase Details
Closed on
Jul 15, 2014
Sold by
Whitney David M and Whitney Van Trease
Bought by
Van Trease Whitney Family Trust
Current Estimated Value
Purchase Details
Closed on
May 5, 2004
Sold by
Mcleod Bruce D and Mcleod Gay E
Bought by
Whitney David M and Vantrease Kristina E
Home Financials for this Owner
Home Financials are based on the most recent Mortgage that was taken out on this home.
Original Mortgage
$795,000
Outstanding Balance
$362,752
Interest Rate
5.12%
Mortgage Type
Purchase Money Mortgage
Estimated Equity
$2,127,197
Purchase Details
Closed on
Jan 6, 1998
Sold by
Mcleod Gay E
Bought by
Mcleod Bruce D
Home Financials for this Owner
Home Financials are based on the most recent Mortgage that was taken out on this home.
Original Mortgage
$456,000
Interest Rate
4.95%
Purchase Details
Closed on
Dec 26, 1996
Sold by
M B S Partners
Bought by
David Homes Inc
Create a Home Valuation Report for This Property
The Home Valuation Report is an in-depth analysis detailing your home's value as well as a comparison with similar homes in the area
Home Values in the Area
Average Home Value in this Area
Purchase History
| Date | Buyer | Sale Price | Title Company |
|---|---|---|---|
| Van Trease Whitney Family Trust | -- | None Available | |
| Whitney David M | $1,060,000 | Ticor Title Company Of Ca | |
| Mcleod Bruce D | -- | Old Republic Title Company | |
| Mcleod Bruce D | $570,000 | Old Republic Title Company | |
| David Homes Inc | $155,000 | First American Title Guarant |
Source: Public Records
Mortgage History
| Date | Status | Borrower | Loan Amount |
|---|---|---|---|
| Open | Whitney David M | $795,000 | |
| Previous Owner | Mcleod Bruce D | $456,000 | |
| Closed | Whitney David M | $150,000 |
Source: Public Records
Tax History Compared to Growth
Tax History
| Year | Tax Paid | Tax Assessment Tax Assessment Total Assessment is a certain percentage of the fair market value that is determined by local assessors to be the total taxable value of land and additions on the property. | Land | Improvement |
|---|---|---|---|---|
| 2025 | $18,331 | $1,544,612 | $452,103 | $1,099,509 |
| 2024 | $18,331 | $1,514,197 | $443,241 | $1,077,956 |
| 2023 | $18,093 | $1,491,369 | $434,550 | $1,056,819 |
| 2022 | $17,866 | $1,455,131 | $426,030 | $1,036,101 |
| 2021 | $17,529 | $1,426,472 | $417,680 | $1,015,792 |
| 2020 | $17,048 | $1,418,782 | $413,400 | $1,005,382 |
| 2019 | $17,147 | $1,390,963 | $405,294 | $985,669 |
| 2018 | $16,817 | $1,363,690 | $397,347 | $966,343 |
| 2017 | $16,412 | $1,336,952 | $389,556 | $947,396 |
| 2016 | $15,852 | $1,310,738 | $381,918 | $928,820 |
| 2015 | $14,854 | $1,291,049 | $376,181 | $914,868 |
| 2014 | $13,440 | $1,160,000 | $348,000 | $812,000 |
Source: Public Records
Map
Nearby Homes
- 2323 Grosvenor Heights Ct Unit C
- 2276 Stonebridge Rd
- 2858 Superior Dr
- 1484 Heidelberg Dr
- 1110 Lomitas Ave
- 2583 Regent Rd
- 2553 Regent Rd
- 1734 Catalina Ct
- 2597 Ancona Cir
- 1467 Hudson Way
- 3080 Bresso Dr
- 601 Orion Way
- 578 Regulus Rd
- 1077 Aberdeen Ave
- 1909 De Vaca Way
- 1004 Vienna St
- 1810 Peary Way
- 628 Lido Dr
- 822 Cortez Ct
- 578 Escondido Cir
- 1560 Frederick Michael Way
- 1571 Frederick Michael Way
- 2420 Upland Ct
- 00 Marina Ave
- 1556 Wedgewood Ct
- 2490 Upland Ct
- 1597 Frederick Michael Way
- 1544 Frederick Michael Way
- 2478 Upland Ct
- 1555 Frederick Michael Way
- 1603 Frederick Michael Way
- 2432 Upland Ct
- 2466 Upland Ct
- 1539 Frederick Michael Way
- 1625 Frederick Michael Way
- 2324 Wedgewood Way
- 1534 Wedgewood Ct
- 1528 Frederick Michael Way
- 2464 Merritt Place
- 2412 Calderon Ct