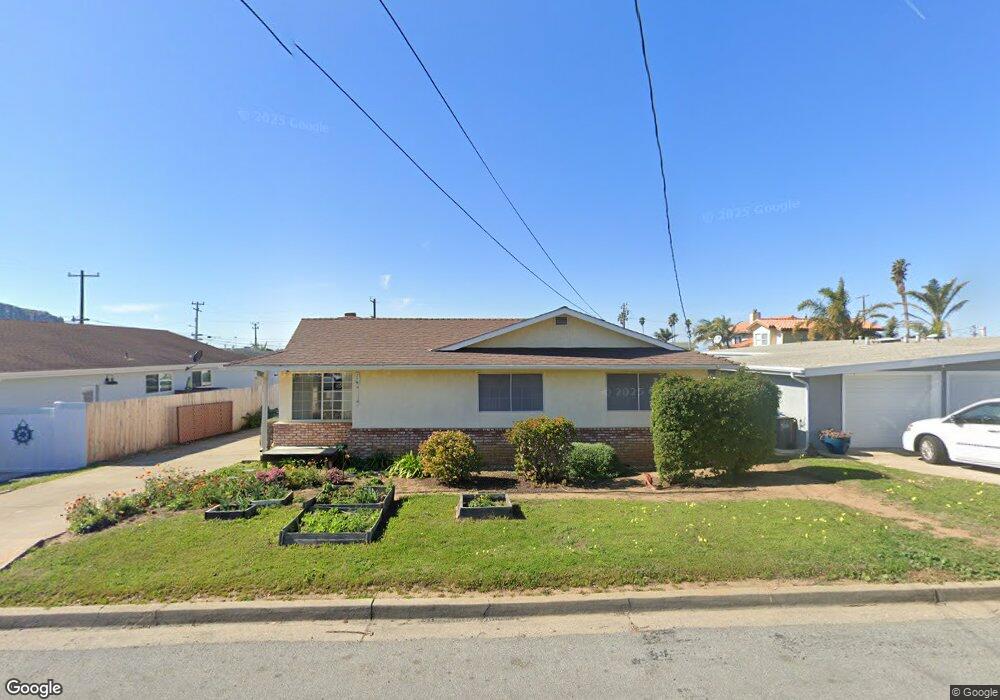
2409 Elm Ave Morro Bay, CA 93442
Estimated Value: $925,102 - $1,102,000
3
Beds
2
Baths
1,396
Sq Ft
$708/Sq Ft
Est. Value
About This Home
This home is located at 2409 Elm Ave, Morro Bay, CA 93442 and is currently estimated at $988,276, approximately $707 per square foot. 2409 Elm Ave is a home located in San Luis Obispo County with nearby schools including Del Mar Elementary School, Los Osos Middle School, and Morro Bay High School.
Ownership History
Date
Name
Owned For
Owner Type
Purchase Details
Closed on
Sep 25, 2025
Sold by
Battaglia Frank C and Li Dorit
Bought by
Battaglia Dorit E and Battaglia Frank C
Current Estimated Value
Home Financials for this Owner
Home Financials are based on the most recent Mortgage that was taken out on this home.
Original Mortgage
$350,000
Outstanding Balance
$350,000
Interest Rate
6.58%
Mortgage Type
New Conventional
Estimated Equity
$638,276
Purchase Details
Closed on
Jun 13, 2023
Sold by
Battaglia Dorit E
Bought by
Frank C Battaglia & Dorit E Battaglia Living
Purchase Details
Closed on
Jun 9, 2022
Sold by
Christopher Battaglia Frank
Bought by
Battaglia Dorit Christopher
Purchase Details
Closed on
Jan 17, 1994
Sold by
Dudley Charles W and Dudley Arlene T
Bought by
Dudley Charles and Dudley Arlene
Purchase Details
Closed on
Dec 30, 1993
Sold by
Dudley Charles and Dudley Arlene
Bought by
Dudley Charles and Dudley Arlene
Create a Home Valuation Report for This Property
The Home Valuation Report is an in-depth analysis detailing your home's value as well as a comparison with similar homes in the area
Home Values in the Area
Average Home Value in this Area
Purchase History
| Date | Buyer | Sale Price | Title Company |
|---|---|---|---|
| Battaglia Dorit E | -- | Chicago Title Company | |
| Frank C Battaglia & Dorit E Battaglia Living | -- | None Listed On Document | |
| Battaglia Dorit Christopher | -- | Kahn Soares & Conway | |
| Battaglia Dorit | -- | Kahn Soares & Conway Llp | |
| Dudley Arlene T | -- | Kahn Soares & Conway Llp | |
| Dudley Charles | -- | -- | |
| Dudley Charles | -- | -- |
Source: Public Records
Mortgage History
| Date | Status | Borrower | Loan Amount |
|---|---|---|---|
| Open | Battaglia Dorit E | $350,000 |
Source: Public Records
Tax History Compared to Growth
Tax History
| Year | Tax Paid | Tax Assessment Tax Assessment Total Assessment is a certain percentage of the fair market value that is determined by local assessors to be the total taxable value of land and additions on the property. | Land | Improvement |
|---|---|---|---|---|
| 2025 | $9,486 | $875,496 | $530,604 | $344,892 |
| 2024 | $9,314 | $858,330 | $520,200 | $338,130 |
| 2023 | $9,314 | $841,500 | $510,000 | $331,500 |
| 2022 | $2,450 | $231,508 | $76,538 | $154,970 |
| 2021 | $2,411 | $226,970 | $75,038 | $151,932 |
| 2020 | $2,386 | $224,644 | $74,269 | $150,375 |
| 2019 | $2,362 | $220,240 | $72,813 | $147,427 |
| 2018 | $2,315 | $215,923 | $71,386 | $144,537 |
| 2017 | $2,270 | $211,690 | $69,987 | $141,703 |
| 2016 | $2,225 | $207,540 | $68,615 | $138,925 |
| 2015 | $2,191 | $204,424 | $67,585 | $136,839 |
| 2014 | $2,012 | $200,421 | $66,262 | $134,159 |
Source: Public Records
Map
Nearby Homes
- 2360 Hemlock Ave
- 2479 Hemlock Ave
- 2695 Hemlock Ave
- 399 Hill St
- 2278 Emerald Cir
- 2675 Juniper Ave
- 2587 Laurel Ave
- 410 Sunset Ct
- 2637 Laurel Ave
- 2556 Nutmeg Ave
- 679 Elena St
- 2630 Maple Ave
- 2825 Hemlock Ave
- 2680 Maple Ave
- 2884 Alder Ave
- 0 Atascadero Rd
- 500 Atascadero Rd Unit D8
- 2783 Coral Ave
- 2900 Alder Ave
- 2931 Hemlock Ave