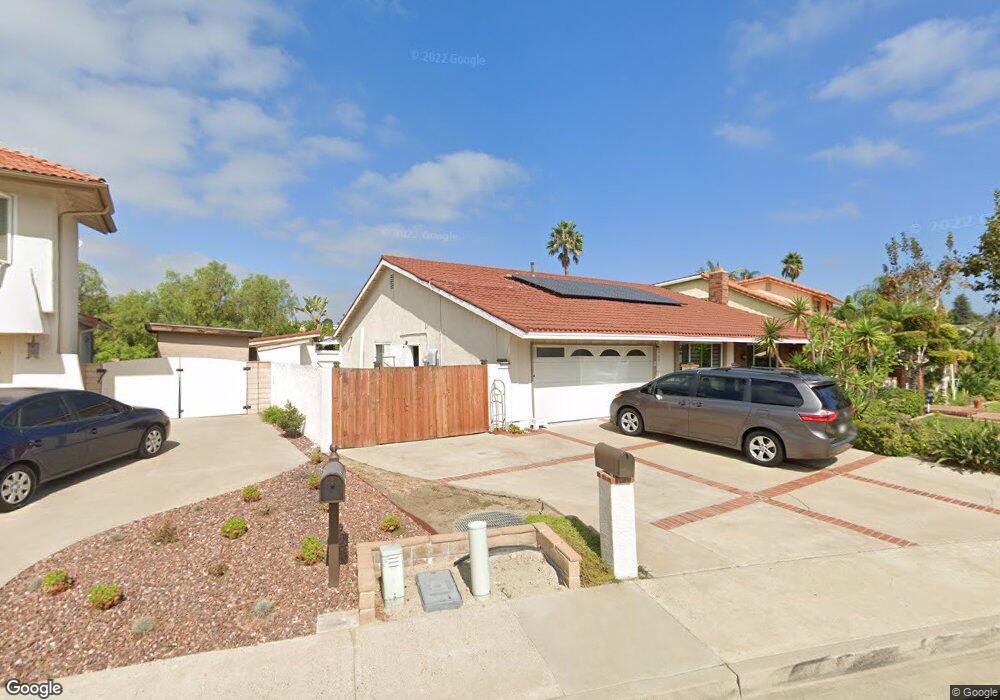
24097 Via Luisa Mission Viejo, CA 92691
Estimated Value: $1,298,000 - $1,494,000
4
Beds
2
Baths
1,836
Sq Ft
$741/Sq Ft
Est. Value
About This Home
This home is located at 24097 Via Luisa, Mission Viejo, CA 92691 and is currently estimated at $1,359,760, approximately $740 per square foot. 24097 Via Luisa is a home located in Orange County with nearby schools including Montevideo Elementary School, La Paz Intermediate School, and Mission Viejo High School.
Ownership History
Date
Name
Owned For
Owner Type
Purchase Details
Closed on
Jul 23, 2020
Sold by
Kim Andrew Kyuchui and Kim Anna
Bought by
Kim Andrew Kyuchui and Kim Ok Sun
Current Estimated Value
Purchase Details
Closed on
Apr 30, 2020
Sold by
Andrew K Kim Family Limited Partnership
Bought by
Kim Andrew Kyuchul and Kim Anna
Home Financials for this Owner
Home Financials are based on the most recent Mortgage that was taken out on this home.
Original Mortgage
$333,000
Interest Rate
3.3%
Mortgage Type
New Conventional
Purchase Details
Closed on
Feb 10, 2017
Sold by
Kim Andrew Kyuchul and Kim Ok Sun
Bought by
Andrew Y Kim Fmaily Lp
Purchase Details
Closed on
Apr 2, 1997
Sold by
Stein Ronald B and Douglas B Stein Trust
Bought by
Kim Andrew Kyuchul and Kim Ok Sun
Home Financials for this Owner
Home Financials are based on the most recent Mortgage that was taken out on this home.
Original Mortgage
$184,000
Interest Rate
7.96%
Create a Home Valuation Report for This Property
The Home Valuation Report is an in-depth analysis detailing your home's value as well as a comparison with similar homes in the area
Home Values in the Area
Average Home Value in this Area
Purchase History
| Date | Buyer | Sale Price | Title Company |
|---|---|---|---|
| Kim Andrew Kyuchui | -- | None Available | |
| Kim Andrew Kyuchul | -- | Pacific Coast Title Company | |
| Andrew Y Kim Fmaily Lp | -- | None Available | |
| Kim Andrew Kyuchul | $230,000 | Chicago Title Co |
Source: Public Records
Mortgage History
| Date | Status | Borrower | Loan Amount |
|---|---|---|---|
| Previous Owner | Kim Andrew Kyuchul | $333,000 | |
| Previous Owner | Kim Andrew Kyuchul | $184,000 |
Source: Public Records
Tax History Compared to Growth
Tax History
| Year | Tax Paid | Tax Assessment Tax Assessment Total Assessment is a certain percentage of the fair market value that is determined by local assessors to be the total taxable value of land and additions on the property. | Land | Improvement |
|---|---|---|---|---|
| 2025 | $3,724 | $374,588 | $212,913 | $161,675 |
| 2024 | $3,724 | $367,244 | $208,739 | $158,505 |
| 2023 | $3,635 | $360,044 | $204,646 | $155,398 |
| 2022 | $3,569 | $352,985 | $200,634 | $152,351 |
| 2021 | $8,415 | $825,663 | $664,802 | $160,861 |
| 2020 | $3,537 | $342,516 | $194,683 | $147,833 |
| 2019 | $3,467 | $335,800 | $190,865 | $144,935 |
| 2018 | $7,879 | $765,000 | $615,755 | $149,245 |
| 2017 | $3,262 | $322,761 | $183,453 | $139,308 |
| 2016 | $3,207 | $316,433 | $179,856 | $136,577 |
| 2015 | $3,167 | $311,680 | $177,154 | $134,526 |
| 2014 | $3,097 | $305,575 | $173,684 | $131,891 |
Source: Public Records
Map
Nearby Homes
- 26655 Avenida Deseo
- 24392 Macedo Dr
- 26862 Salazar Dr
- 27301 Via Avila
- 27382 Via Cortez
- 24662 Embajadores Ln
- 26511 Naccome Dr
- 24362 Via Santa Clara
- 24102 Castilla Ln
- 24712 San Vincent Ln
- 27241 Via Burgos
- 23662 Via San Gil
- 26752 Carretas Dr
- 26702 Via Linares
- 23431 Via Guadix
- 24312 Chrisanta Dr
- 23336 Via Bahia
- 27695 Via Turina
- 27705 Via Rodrigo
- 23641 Coronel Dr
- 24081 La Chiquita Dr
- 24101 Via Luisa
- 24071 La Chiquita Dr
- 24111 Via Luisa
- 24062 Valyermo Dr
- 24072 Valyermo Dr
- 24102 Via Luisa
- 24096 Via Luisa
- 24095 Via Luisa
- 24042 Valyermo Dr
- 24082 Valyermo Dr
- 24061 La Chiquita Dr
- 24121 Via Luisa
- 24032 Valyermo Dr
- 24122 Via Luisa
- 24092 Via Luisa
- 24092 Valyermo Dr
- 24091 Via Luisa
- 24131 Puerta de Luz
- 24022 Valyermo Dr