2409W W Vineland Rd Augusta, GA 30904
Lakemont NeighborhoodEstimated Value: $262,000 - $368,000
3
Beds
2
Baths
1,364
Sq Ft
$226/Sq Ft
Est. Value
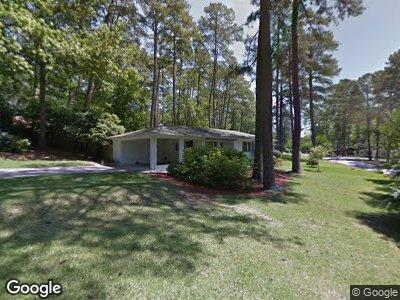
About This Home
This home is located at 2409W W Vineland Rd, Augusta, GA 30904 and is currently estimated at $307,686, approximately $225 per square foot. 2409W W Vineland Rd is a home located in Richmond County with nearby schools including Garrett Elementary School, Tutt Middle School, and Johnson Magnet.
Ownership History
Date
Name
Owned For
Owner Type
Purchase Details
Closed on
Mar 31, 2020
Sold by
Winberg Charles
Bought by
Winberg Charles and Donahue Judithanne
Current Estimated Value
Home Financials for this Owner
Home Financials are based on the most recent Mortgage that was taken out on this home.
Original Mortgage
$229,500
Outstanding Balance
$206,482
Interest Rate
3.05%
Mortgage Type
FHA
Estimated Equity
$95,594
Purchase Details
Closed on
Aug 30, 2017
Sold by
Eifrig David E
Bought by
Winberg Charles and Winberg Judithanne Donahue
Purchase Details
Closed on
Jun 24, 2004
Sold by
Shafer Keith E and Shafer June A
Bought by
Eifrig David E
Home Financials for this Owner
Home Financials are based on the most recent Mortgage that was taken out on this home.
Original Mortgage
$117,900
Interest Rate
4.87%
Mortgage Type
Purchase Money Mortgage
Purchase Details
Closed on
Jun 1, 1984
Create a Home Valuation Report for This Property
The Home Valuation Report is an in-depth analysis detailing your home's value as well as a comparison with similar homes in the area
Home Values in the Area
Average Home Value in this Area
Purchase History
| Date | Buyer | Sale Price | Title Company |
|---|---|---|---|
| Winberg Charles | -- | -- | |
| Winberg Charles | $141,500 | -- | |
| Eifrig David E | $117,900 | -- |
Source: Public Records
Mortgage History
| Date | Status | Borrower | Loan Amount |
|---|---|---|---|
| Open | Winberg Charles | $229,500 | |
| Closed | Winberg Charles | $229,500 | |
| Previous Owner | Winberg Charles | $228,000 | |
| Previous Owner | Eifrig David E | $117,900 | |
| Previous Owner | Shafer Keith E | $38,163 | |
| Previous Owner | Shafer Keith E | $15,000 | |
| Previous Owner | Shafer Keith E | $78,851 |
Source: Public Records
Tax History Compared to Growth
Tax History
| Year | Tax Paid | Tax Assessment Tax Assessment Total Assessment is a certain percentage of the fair market value that is determined by local assessors to be the total taxable value of land and additions on the property. | Land | Improvement |
|---|---|---|---|---|
| 2024 | $1,377 | $105,404 | $19,800 | $85,604 |
| 2023 | $1,377 | $96,800 | $19,800 | $77,000 |
| 2022 | $1,385 | $88,136 | $19,800 | $68,336 |
| 2021 | $1,242 | $69,369 | $19,800 | $49,569 |
| 2020 | $1,251 | $69,369 | $19,800 | $49,569 |
| 2019 | $1,102 | $55,722 | $10,800 | $44,922 |
| 2018 | $1,110 | $55,722 | $10,800 | $44,922 |
| 2017 | $2,113 | $55,722 | $10,800 | $44,922 |
| 2016 | $2,113 | $55,722 | $10,800 | $44,922 |
| 2015 | $2,127 | $55,722 | $10,800 | $44,922 |
| 2014 | $2,129 | $55,722 | $10,800 | $44,922 |
Source: Public Records
Map
Nearby Homes
- 2406 Mohican Rd
- 243 Water Oak Dr
- 241 Water Oak Dr
- 227 Water Oak Dr
- 301 White Ash Ct
- 2220 Edgewood Dr
- 102 Morningside Ct
- 2314 Redwood Dr
- 2221 Edgewood Dr
- 2327 Redwood Dr
- 2210 Glendale Rd
- 2319 Woodbine Rd
- 411 Brookside Dr
- 1020 Stewart Ave
- 415 Brookside Dr
- 2370 Fitten St
- 2354 Fitten St
- 2348 Fitten St
- 2417 Wilkshire Dr
- 501 Milledge Rd Unit 3D
- 2409W W Vineland Rd
- 2412 Hiawassee Rd
- 2414 Hiawassee Rd
- 273 W Vineland Rd
- 2408 Hiawassee Rd
- 271 W Vineland Rd
- 2405E E Vineland Rd
- 2405 E Vineland Rd
- 275W W Vineland Rd
- 273W W Vineland Rd
- 277W W Vineland Rd
- 271W W Vineland Rd
- 279W W Vineland Rd
- 2404 Hiawassee Rd
- 269 W Vineland Rd
- 0 Kings Knob Ct Unit MAP 5 8352617
- C 3 Kings Knob Ct
- C 3 Kings Knob Ct Unit C 3
- 0 Kings Knob Ct Unit TR 11,C3 8352653
- 0 Kings Knob Ct Unit E,C16 8352617