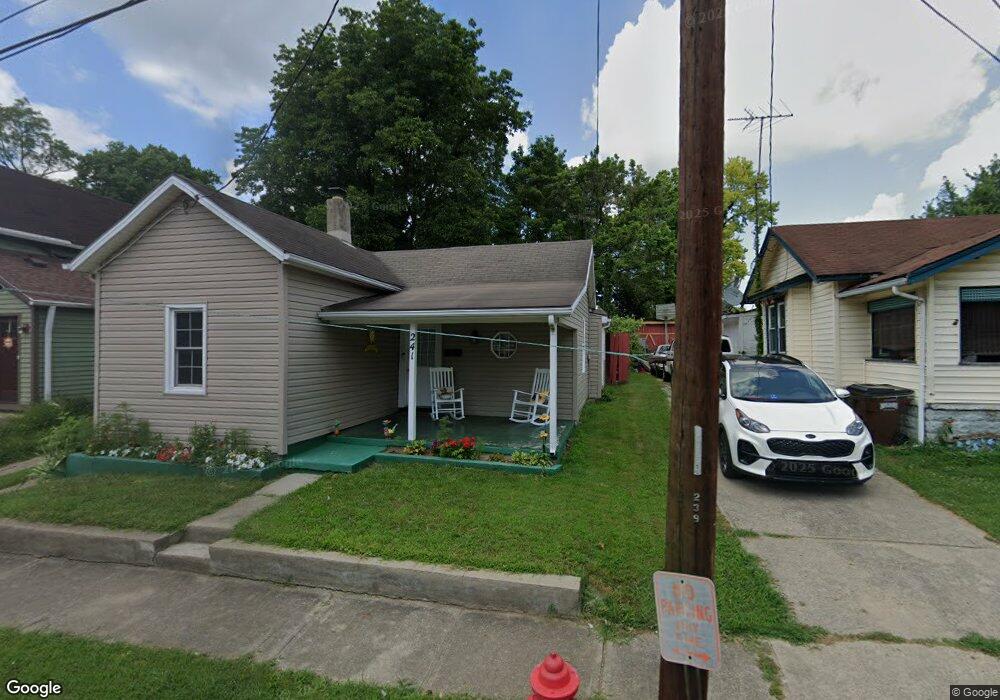
241 Allen St Franklin, OH 45005
Estimated Value: $91,000 - $152,000
2
Beds
1
Bath
706
Sq Ft
$161/Sq Ft
Est. Value
About This Home
2bed 1bath 1car detached garage fenced in yard absolutely no pets!! Smoke free house rent is $1050.00 per month and $1050.00 deposit back ground check required
Ownership History
Date
Name
Owned For
Owner Type
Purchase Details
Closed on
May 30, 2006
Sold by
Lewmarreo Llc
Bought by
Levangie David A
Current Estimated Value
Purchase Details
Closed on
Aug 18, 2004
Sold by
Kirby Garry D and Mortgage Electronic Registrati
Bought by
Jp Morgan Chase Bank
Purchase Details
Closed on
Mar 28, 2003
Sold by
Palmer Frances
Bought by
Kirby Garry D
Home Financials for this Owner
Home Financials are based on the most recent Mortgage that was taken out on this home.
Original Mortgage
$40,000
Interest Rate
8.25%
Mortgage Type
Purchase Money Mortgage
Create a Home Valuation Report for This Property
The Home Valuation Report is an in-depth analysis detailing your home's value as well as a comparison with similar homes in the area
Home Values in the Area
Average Home Value in this Area
Purchase History
| Date | Buyer | Sale Price | Title Company |
|---|---|---|---|
| Levangie David A | $19,000 | Diamond Title Company Inc | |
| Lewmarreo Llc | $19,000 | Diamond Title Company Inc | |
| Jp Morgan Chase Bank | $30,000 | -- | |
| Kirby Garry D | $40,000 | -- |
Source: Public Records
Mortgage History
| Date | Status | Borrower | Loan Amount |
|---|---|---|---|
| Previous Owner | Kirby Garry D | $40,000 |
Source: Public Records
Property History
| Date | Event | Price | List to Sale | Price per Sq Ft |
|---|---|---|---|---|
| 11/15/2024 11/15/24 | Off Market | $1,050 | -- | -- |
| 10/21/2024 10/21/24 | For Rent | $1,050 | -- | -- |
Tax History Compared to Growth
Tax History
| Year | Tax Paid | Tax Assessment Tax Assessment Total Assessment is a certain percentage of the fair market value that is determined by local assessors to be the total taxable value of land and additions on the property. | Land | Improvement |
|---|---|---|---|---|
| 2024 | $947 | $20,130 | $5,530 | $14,600 |
| 2023 | $883 | $15,316 | $3,132 | $12,183 |
| 2022 | $867 | $15,316 | $3,133 | $12,184 |
| 2021 | $985 | $15,316 | $3,133 | $12,184 |
| 2020 | $752 | $12,159 | $2,489 | $9,671 |
| 2019 | $691 | $12,159 | $2,489 | $9,671 |
| 2018 | $603 | $12,159 | $2,489 | $9,671 |
| 2017 | $600 | $10,889 | $2,391 | $8,498 |
| 2016 | $611 | $10,889 | $2,391 | $8,498 |
| 2015 | $611 | $10,889 | $2,391 | $8,498 |
| 2014 | $627 | $10,890 | $2,390 | $8,500 |
| 2013 | $532 | $12,600 | $2,770 | $9,830 |
Source: Public Records
Map
Nearby Homes
- 441 Sunnybrook Dr
- 121 E 5th St
- 7 Highland St
- 519 Anderson St
- 0 E 4th St
- 388 Thomas Dr
- 521 S Main St
- 551 E 2nd St
- 50 N Main St
- 1200 Riley Blvd
- 235 S Main St
- 233 S Main St
- 590 Kristine Ln
- 747 David Blvd
- 627 S River St
- 760 David Blvd
- 631 S River St
- 0 Victoria Dr Unit 942075
- 0 Victoria Dr Unit 1852824
- 56 Skokiaan Dr